Bonds - Bearish - 3rd Week of April Looking for Bonds to complete MMSM, perfectly correlated with yields & dxy completing their corresponding MMBM.
ZFZ2022 trade ideas

Bearish Quarterly Shift on Bonds Possibly Invalidated I thought a possible bearish retracement for this quarter could be possible but bonds seems to be bullish. Bearish price action looks like runs on stops. Will continue to watch. As of now, I switch to neutral. My longer term mmbm idea seems to be playing out a lot more aggressively than I expected.

Bonds - Possible Bearish Quarterly ShiftBonds is continuously breaking daily lows. Would like to see a body close market structure shift lower for a clear sign of bearish shift.

5 Year T-Notes Long Idea Long on Donchian 4 week break out rules for a major change in trend. Lets see where this gets us.

Test2Test Test TestTest Test TestTest Test TestTest Test TestTest Test TestTest Test TestTest Test TestTest Test TestTest Test TestTest Test Test

ZF (and bonds in general) carnageThe expected turnaround did not happened, and the 61.8 Fibo is now a resistance.

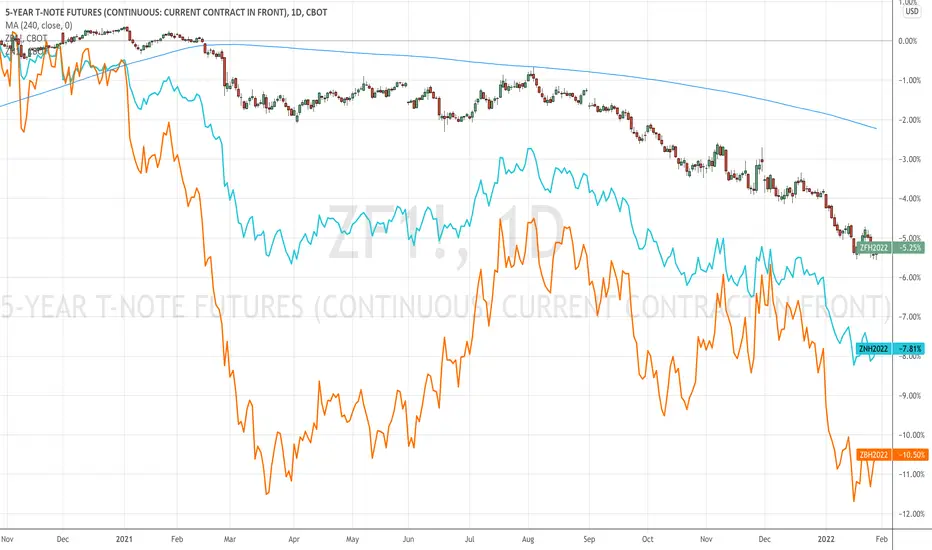
T-Notes 4 week breakoutThis is reference chart for my recent trade idea to explain why I am going long T-Notes Futures.

5 Year T-Note Futures 1 tick = 0.0078125
Tick Value = $7.8125
What I call 1 point is 4 ticks or 0.03125 ($31.25)
Bought at 112'09'2 Stop 112'07'0


ZF - looks like a bottomFive year notes show clear divergence against momentum indicators, bottom might be in place.

ZF - is the bottom finally formingStock market is tanking under the weight of higher interest rates. Will there be a reversal in rates? Flight to safety anyone?


ZF five year note completing the pattern.It is probably not there yet, but it should be close, so be on look out.

ZF - impulse to the upsideSimilar pattern (seee previous post) can be found in five year note, which would suggest that FED tightening is fully priced and that market is starting to anticipate the recession, and bear market in stocks.

Evolution of bonds when interest rate expectations augment, by dEvolution of bonds when interest rate expectations augment, by duration
Treasuary 5 yearsThis detail of price development to the hourly chart is based on a previously published global analysis.


Downward trend in ZFAfter an impulse to the downside, 5year notes went sideways for several moths, corrected 50%, and presumably made an initial small impulsive wave lately to begin the second leg down. Will it be a third or a C wave is yet to be established.
Should stay beneath the magenta MA though.

5 Year T-Note Futures Heading Lower Towards 123Disclaimer
The views expressed are mine and do not represent the views of my employers and business partners. Persons acting on these recommendations are doing so at their own risk. These recommendations are not a solicitation to buy or to sell but are for purely discussion purposes. At the time publishing, I have a position in 5-Year T-Note Futures (ZF1!) .
Trend Analysis
The main view of this trade idea is on the 2-Hour chart. zf1! has been channeling lower after making a high of 124’08 on July 8th. First low was observed on July 13th around the 123’18”5 price level and a lower high is seen around 124 on July 15th. ZF1! Is expected to make a lower low at 123’14”5 in the short term.
Technical Indicators
ZF1! is currently below its short (25-SMA), medium (75-SMA) and fractal moving averages and its RSI is trading below 50. Moreover, the KST recently had a negative crossover.
Recommendation
The recommendation will be to go short at market. At the time of publishing ZF1!is trading around 123’25”2. The medium-term target price is observed around the 123’14”5 price level. A stop loss is set at 124. This produces a risk reward ratio of 1.54.


Yield CurveZF, ZN, and ZB.....Front end unchanged for the most part with the back end on the yield curve steepening.


