USDCHF LongBased on the chart and analysis, I expect a rise in this chart from a higher time to four hours
CHFUSD trade ideas

CATCHING THE BULLISH EXPANSION ON USDCHFUSDCHF has been great buy trend however we have seen several days of bearishness which i consider just a repricing to fill our bullish block... we however might see bullishness this week and the next to meet the higher time frame narative. Goodluck traders, catch the continuation the Green promising way

USDCHF showing bullish divergenceUSD/CHF was trending downwards but exhibited a bullish divergence in the RSI, indicating a potential reversal of the pattern.

SELL TRADE SETUP FOR THE USDCHFThe pair USDCHF has a possible probability of sniper entry for a bearish trade; where in a Fair Value Gap (FVG) and Order Block (OB) formation is seen.
The fundamentals are also suggesting bearish for the USD and mixed to bullish data for the CHF.
We wait for the levels and then take the entry for best possible results with 1:1 Risk Reward or you can also ride the trend with trailing stop loss....
Your Views ????

USDCHF at Support LevelThis currency pair is at a support level. Prices had rejected that zone several times.
Although the structure looks like a head and shoulder pattern, the support level hasn't been broken yet therefore an opportunity to buy is the best choice.
The profit target should be the first resistance level.
DISCLAIMER
The signals provided by LeoFX are for informational purposes only and do not constitute investment advice. We do not guarantee the accuracy, completeness, or timeliness of the signals, and we are not responsible for any losses or damages arising from the use of our signals.

USDCHF showing bullish divergenceUSD/CHF was trending downwards but exhibited a bullish divergence in the RSI, indicating a potential reversal of the pattern.

SELL TRADE SETUP ON USDCHFHey Trader,
Check out this analysis on USDCHF.
A long entry plan is best above the intraday support area (leading to the range continuation).
Alternatively, a short trade can be considered if the price breaks below the intraday key zone (support), retests, and resists. A short trade can be considered.
Trade safe.

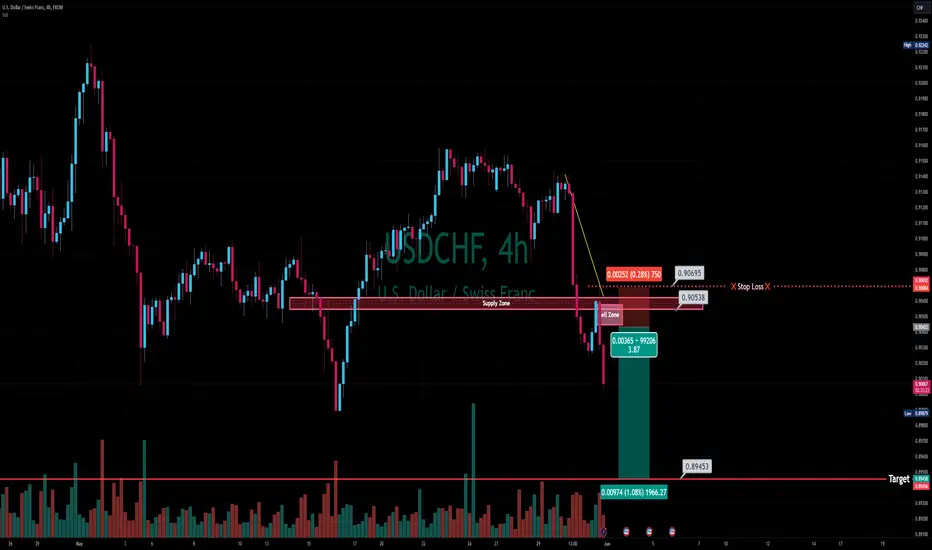
USDCHF H4 Bearish reversal?Based on the H4 chart analysis, we can see that the price is rising toward our sell entry at 0.9030, which is a pullback resistance.
Our take profit will be at 0.8988, a swing-low support level close to 161.8% Fibo extension
The stop loss will be placed at 0.9070, an overlap resistance level.
High Risk Investment Warning
Trading Forex/CFDs on margin carries a high level of risk and may not be suitable for all investors. Leverage can work against you.
Stratos Markets Limited (www.fxcm.com):
CFDs are complex instruments and come with a high risk of losing money rapidly due to leverage. 68% of retail investor accounts lose money when trading CFDs with this provider. You should consider whether you understand how CFDs work and whether you can afford to take the high risk of losing your money.
Stratos Europe Ltd, previously FXCM EU Ltd (www.fxcm.com):
CFDs are complex instruments and come with a high risk of losing money rapidly due to leverage. 70% of retail investor accounts lose money when trading CFDs with this provider. You should consider whether you understand how CFDs work and whether you can afford to take the high risk of losing your money.
Stratos Trading Pty. Limited (www.fxcm.com):
Trading FX/CFDs carries significant risks. FXCM AU (AFSL 309763), please read the Financial Services Guide, Product Disclosure Statement, Target Market Determination and Terms of Business at www.fxcm.com
Stratos Global LLC (www.fxcm.com):
Losses can exceed deposits.
Please be advised that the information presented on TradingView is provided to FXCM (‘Company’, ‘we’) by a third-party provider (‘TFA Global Pte Ltd’). Please be reminded that you are solely responsible for the trading decisions on your account. There is a very high degree of risk involved in trading. Any information and/or content is intended entirely for research, educational and informational purposes only and does not constitute investment or consultation advice or investment strategy. The information is not tailored to the investment needs of any specific person and therefore does not involve a consideration of any of the investment objectives, financial situation or needs of any viewer that may receive it. Kindly also note that past performance is not a reliable indicator of future results. Actual results may differ materially from those anticipated in forward-looking or past performance statements. We assume no liability as to the accuracy or completeness of any of the information and/or content provided herein and the Company cannot be held responsible for any omission, mistake nor for any loss or damage including without limitation to any loss of profit which may arise from reliance on any information supplied by TFA Global Pte Ltd.
The speaker(s) is neither an employee, agent nor representative of FXCM and is therefore acting independently. The opinions given are their own, constitute general market commentary, and do not constitute the opinion or advice of FXCM or any form of personal or investment advice. FXCM neither endorses nor guarantees offerings of third party speakers, nor is FXCM responsible for the content, veracity or opinions of third-party speakers, presenters or participants.

USDCHF WEEKLY ANALYSISHello, traders here is a setup of USDCHF as you can see the price has been in a bullish form for the past weeks and now it has reached a zone of resistance that has been tested multiple times in the past and the price started showing rejection signs from the resistance zone as you can see there are two bearish engulfments candle sticks and that is a sign that price can go down in any moment.

Bullish bounce off pullback support?USD/CHF is falling towards the pivot which has been identified as a pullback support and could bounce to the overlap resistance.
Pivot: 0.8988
1st Support: 0.8918
1st Resistance: 0.9094
Risk Warning:
Trading Forex and CFDs carries a high level of risk to your capital and you should only trade with money you can afford to lose. Trading Forex and CFDs may not be suitable for all investors, so please ensure that you fully understand the risks involved and seek independent advice if necessary.
Disclaimer:
The above opinions given constitute general market commentary, and do not constitute the opinion or advice of IC Markets or any form of personal or investment advice.
Any opinions, news, research, analyses, prices, other information, or links to third-party sites contained on this website are provided on an "as-is" basis, are intended only to be informative, is not an advice nor a recommendation, nor research, or a record of our trading prices, or an offer of, or solicitation for a transaction in any financial instrument and thus should not be treated as such. The information provided does not involve any specific investment objectives, financial situation and needs of any specific person who may receive it. Please be aware, that past performance is not a reliable indicator of future performance and/or results. Past Performance or Forward-looking scenarios based upon the reasonable beliefs of the third-party provider are not a guarantee of future performance. Actual results may differ materially from those anticipated in forward-looking or past performance statements. IC Markets makes no representation or warranty and assumes no liability as to the accuracy or completeness of the information provided, nor any loss arising from any investment based on a recommendation, forecast or any information supplied by any third-party.

USDCHF Trading IdeaBased on Simple Technical Analysis ( Trendline + Support & Resistance )
Risk Disclaimer:
Please be advised that I am not telling anyone how to spend or invest their money. Take all of my analysis as my own opinion, as entertainment, and at your own risk. I assume no responsibility or liability for any errors or omissions in the content of this page, and they are for educational purposes only. Any action you take on the information in these analysis is strictly at your own risk. There is a very high degree of risk involved in trading. Past results are not indicative of future returns. Good luck :-)

USDCHF TRADE SETUPWait for retest the key level then take a trade for Sell otherwise skip this setup

USDCHF Buy LimitUSDCHF Daily Buy Limit
Technical Analysis:
Taking The End Of A H4 Correction
Mainly Based On The Tool ( Trend Based Fibonacci )

SELL USDCHD AT THE POINT OF INTEREST i expect the market to come at the point of interest and spike with a big sell
use proper risk management , and have vision for the next move

USDCHF: Long Signal with Entry/SL/TP
USDCHF
- Classic bullish formation
- Our team expects growth
SUGGESTED TRADE:
Swing Trade
Buy USDCHF
Entry Level - 0.9020
Sl - 0.8990
Tp - 0.9072
Our Risk - 1%
Start protection of your profits from lower levels
❤️ Please, support our work with like & comment! ❤️

USD/CHF SELLERS WILL DOMINATE THE MARKET|SHORT
Hello,Friends!
The BB upper band is nearby so USD-CHF is in the overbought territory. Thus, despite the uptrend on the 1W timeframe I think that we will see a bearish reaction from the resistance line above and a move down towards the target at around 0.901.
✅LIKE AND COMMENT MY IDEAS✅

USDCHF LONGThis is just simple trading idea draw into chart using labels and lines. Please use it as educational purpose and you are free to modify any

USD-CHF Bullish Bias! Buy!
Hello,Traders!
USD-CHF is going down
Towards the horizontal
Support level of 0.9000
From where we will be
Expecting a bullish rebound
From the level below
Buy!
Like, comment and subscribe to help us grow!
Check out other forecasts below too!

USDCHF - Divergence - Heikin Ashi - Long1. Market Analysis:
Asset: USDCHF
Timeframe: 1-hour
Pattern: Bullish divergence identified
Candle Type: Heikin Ashi
2. Entry Criteria:
Divergence Confirmation: Identify bullish divergence on the 1-hour timeframe using indicators like RSI or MACD. Bullish divergence occurs when the price forms lower lows, but the indicator forms higher lows.
Heikin Ashi Confirmation: Look for the formation of the first green Heikin Ashi candle after the bullish divergence is identified, indicating a potential reversal and trend change to the upside.
3. Trade Setup:
Entry Point: Place a buy order at the close of the first green Heikin Ashi candle that confirms the bullish reversal.
Stop-Loss: Set the stop-loss order below the low of the most recent swing low or below the low of the green Heikin Ashi candle that confirms the reversal. This helps limit potential losses if the price reverses.
Take-Profit: Determine your take-profit target based on a risk-reward ratio of either 1:1 or 1:2.

Swing trade, short setup USDCHF👋Hello Traders,
Our 🖥️ AI system detected that there is an H4 or higher timeframe ICT Short setup in USDCHF for Swing trade.
Please refer to the details Stop loss, FVG(Sell Zone),open for take profit.
For more ideas, you are welcome to visit our profile in tradingview.
Have a good day!
Please give this post a like if you like this kind of simple idea, your feedback will bring our signal to next better level, thanks for support!
USDCHF WILL EXPLODE BUYManage SL during news time, intraday trade tp and sl mentioned not a financial advice

USD/CHF ShortI prefer to short USD/CHF following an impulsive move to the downside. I'm aiming for a 1:2 RR, expecting the price to reach the area of interest and then break the previous low.

USD/CHF Rate Falls Over 1% After SNB Chief's StatementsUSD/CHF Rate Falls Over 1% After SNB Chief's Statements
As evidenced by the USD/CHF chart, yesterday one US dollar was worth 0.913 Swiss francs, but today it is already 0.903, indicating a rate drop of approximately 1%.
According to MT Newswires, the franc's strengthening is attributed to statements by Swiss National Bank (SNB) President Thomas Jordan. In his view, an overly weak franc is the most likely source of higher inflation in Switzerland.
Notably, since the beginning of 2024, the Swiss franc has weakened against the US dollar by more than 7%, one of the worst performances among G10 currencies. The exchange rate has formed an ascending trend channel (indicated in blue).
Today's USD/CHF chart shows two important resistance lines:
→ The 0.913 level – the price could not consolidate above this level despite several attempts;
→ The median line of the channel.
On May 22, a downward reversal occurred from this resistance block (indicated by an arrow), and today the USD/CHF price is near the lower boundary of the channel.
Bullish arguments:
→ Near the lower boundary of the channel, demand may increase;
→ The psychological level of 0.9 CHF per 1 USD may provide support – this has occurred several times during the spring.
It is likely that the SNB does not want the upward trend to continue, and if so, in the near future, we might see a consolidation in the USD/CHF market within the range of 0.900 – 0.913, until significant fundamental news emerges to disrupt the balance that has been forming since April.
Trade over 50 forex markets 24 hours a day with FXOpen. Take advantage of low commissions, deep liquidity, and spreads from 0.0 pips. Open your FXOpen account now or learn more about trading forex with FXOpen.
This article represents the opinion of the Companies operating under the FXOpen brand only. It is not to be construed as an offer, solicitation, or recommendation with respect to products and services provided by the Companies operating under the FXOpen brand, nor is it to be considered financial advice.
