USDCHFInflation Rate YoY MAR
1% 1.2% 1.3% 1.4%
CPI MAR Waiting for Release
107.1 107.5
Inflation Rate MoM MAR
0% 0.6% 0.3% 0.4%
CHFUSD trade ideas

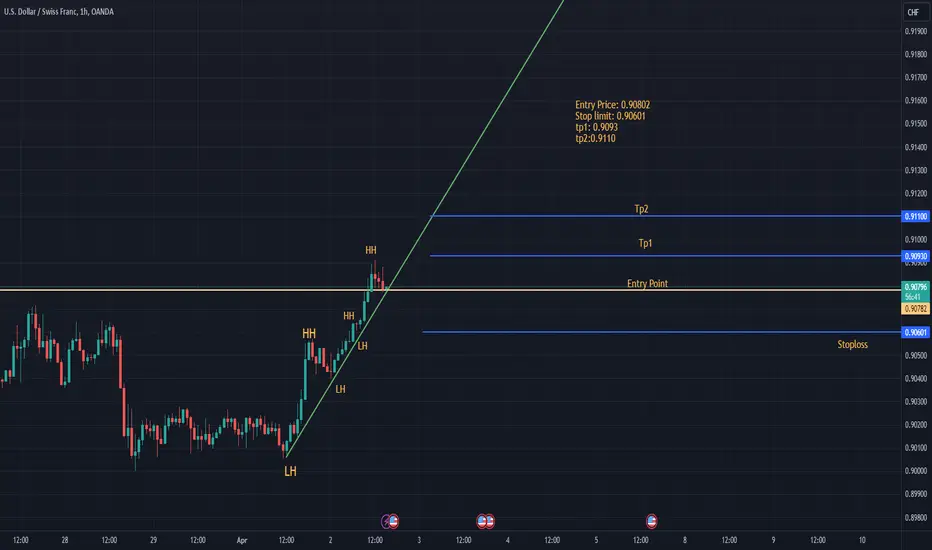
To 0.91240Usdchf has found support on the 5 min tf. A higher high pattern is expected from here stomping out sellers.


swing entry pointi see a great mid-term Long position opportunity in Swissie, we are in swing's key entry point .
what do you think about this article ?
please share your opinion


📈💰💼 **USD/CHF Review** 💼💰📈📈💰💼 **USD/CHF Review** 💼💰📈
Last week, USD/CHF surged to grab previous highs, igniting excitement among traders. 🚀📈 However, upon closer examination in lower time frames, a potential bearish signal emerges. 📉🧐 The formation of a 'sibi' (sideways) pattern suggests a period of consolidation. 🔄📊 Keeping an eye on the chart, the target seems to point towards last week's low. 🎯📉 Traders are advised to exercise caution and closely monitor the market dynamics for potential opportunities. 💡💼✅
Happy trading! 💵💼🌟

USD/CHF Susceptible to RSI Sell SignalUSD/CHF appears to be carving a bearish outside-day (engulfing) candle after registering a fresh yearly high (0.9096), and the Relative Strength Index (RSI) may indicate a textbook sell signal as it struggles to hold above 70.
USD/CHF Rate Outlook
USD/CHF seems to be reversing ahead of the November high (0.9113) as it fails to extend the series of higher highs and lows from the start of the week, and failure to hold above the 0.9030 (38.2% Fibonacci extension) to 0.9040 (23.6% Fibonacci extension) area may lead to a test of the weekly low (0.9006).
Next region of interest comes in around 0.8880 (38.2% Fibonacci retracement) to 0.8910 (38.2% Fibonacci extension), with a break of trendline support opening up the 0.8770 (61.8% Fibonacci extension) to 0.8810 (50% Fibonacci extension).
Nevertheless, USD/CHF may continue to exhibit a bullish trend if it continues to track the positive slope in the 50-Day SMA (0.8823), with a breach above the November high (0.9113) opening up 0.9180 (23.6% Fibonacci extension).
--- Written by David Song, Strategist at FOREX.com

USDCHF trendline fully bullish read the caption The USDCHF earlier today reached up to the highest level of the year at 0.90949. However the last three or four hours have seen a rotation to the downside after the weaker than expected ISM nonmanufacturing data. Fed's Powell also, the market at that sending yields lower and the US dollar lower in the process.
That good news sent the price of the USDCHF down below is 100 hour moving average at 0.9043 and down to the 200 hour moving average 0.90296 Hundreds road lower, the prior highs from last week at 0.9061 and 0.90636

USDCHFAccording to my analysis, USDCHF is experiencing a significant decline today due to the weakness of the US dollar. The release of some negative news has further worsened the situation for the dollar. In light of this, I suggest taking advantage of the opportunity by selling. However, it is advisable to wait until the resistance level corrects before making the sell deal. Wishing you good luck in your trading.

USDCHF 03/04/2024Weekly:
-Buyside liquidity as next target.
-No structure on the left that could stop the price.
Daily:
-Bullish M pattern.
-Imbalance.
4H:
-4H imbalance aligning with the daily imbalance.
-Inverse H&S pattern.

Great anticipationWatch out for that structural liquidity (Yellow line) for a possible reaction. Taking shorts after the break. Wait for confirmation on LTF and apply adequate risk management. Manage your risk and optimise your reward... It's worth it.
#Macro
#HTFstructure
#Inducement
#Followthetrend

USDCHF Bearish BiasUSDCHF is testing its resistance area after forming a double top. A Bearish Divergence is an additional confluence to our Bearish Bias.

Market Analysis: USD/CHF Could Extend GainsMarket Analysis: USD/CHF Could Extend Gains
USD/CHF climbed higher above 0.9070 and might extend gains in the near term.
Important Takeaways for USD/CHF Analysis Today
USD/CHF climbed higher above the 0.9035 and 0.9070 resistance levels.
There was a break above a major bearish trend line with resistance at 0.9035 on the hourly chart at FXOpen.
USD/CHF Technical Analysis
On the hourly chart of USD/CHF at FXOpen, the pair started a decent increase from the 0.9005 support. The US Dollar climbed above the 0.9035 resistance zone against the Swiss Franc.
There was a break above a major bearish trend line with resistance at 0.9035. The bulls were able to pump the pair above the 50-hour simple moving average and 0.9070. Finally, the pair tested the 0.9090 zone.
A high was formed near 0.9090 before there was a minor pullback. The pair declined below the 23.6% Fib retracement level of the upward move from the 0.9005 swing low to the 0.9090 high.
On the downside, immediate support on the USD/CHF chart is near the 0.9070 zone. The first major support is near the 50-hour simple moving average at 0.9055. A downside break below 0.9055 might spark bearish moves. The next major support is near the 61.8% Fib retracement level of the upward move from the 0.9005 swing low to the 0.9090 high at 0.9035.
Any more losses may possibly open the doors for a move toward the 0.9005 level in the near term. On the upside, the pair is now facing resistance near 0.9090.
The next major resistance is at 0.9120. The main resistance is now near 0.9140. If there is a clear break above the 0.9140 resistance zone and the RSI climbs above 65, the pair could start another increase. In the stated case, it could test 0.9200.
This article represents the opinion of the Companies operating under the FXOpen brand only. It is not to be construed as an offer, solicitation, or recommendation with respect to products and services provided by the Companies operating under the FXOpen brand, nor is it to be considered financial advice.

USDCHF H4 | Bullish breakout Based on the H4 chart analysis, we can see that the price is rising toward the pivot which is our buy entry at 0.9067, a bullish breakout
Our take profit will be at 0.9114, which lines up with the 161.8% Fibo extension.
The stop loss will be placed at 0.9010, an overlap esistance level
High Risk Investment Warning
Trading Forex/CFDs on margin carries a high level of risk and may not be suitable for all investors. Leverage can work against you.
Stratos Markets Limited (www.fxcm.com):
CFDs are complex instruments and come with a high risk of losing money rapidly due to leverage. 66% of retail investor accounts lose money when trading CFDs with this provider. You should consider whether you understand how CFDs work and whether you can afford to take the high risk of losing your money.
Stratos Europe Ltd, previously FXCM EU Ltd (www.fxcm.com):
CFDs are complex instruments and come with a high risk of losing money rapidly due to leverage. 70% of retail investor accounts lose money when trading CFDs with this provider. You should consider whether you understand how CFDs work and whether you can afford to take the high risk of losing your money.
Stratos Trading Pty. Limited (www.fxcm.com):
Trading FX/CFDs carries significant risks. FXCM AU (AFSL 309763), please read the Financial Services Guide, Product Disclosure Statement, Target Market Determination and Terms of Business at www.fxcm.com
Stratos Global LLC (www.fxcm.com):
Losses can exceed deposits.
Please be advised that the information presented on TradingView is provided to FXCM (‘Company’, ‘we’) by a third-party provider (‘TFA Global Pte Ltd’). Please be reminded that you are solely responsible for the trading decisions on your account. There is a very high degree of risk involved in trading. Any information and/or content is intended entirely for research, educational and informational purposes only and does not constitute investment or consultation advice or investment strategy. The information is not tailored to the investment needs of any specific person and therefore does not involve a consideration of any of the investment objectives, financial situation or needs of any viewer that may receive it. Kindly also note that past performance is not a reliable indicator of future results. Actual results may differ materially from those anticipated in forward-looking or past performance statements. We assume no liability as to the accuracy or completeness of any of the information and/or content provided herein and the Company cannot be held responsible for any omission, mistake nor for any loss or damage including without limitation to any loss of profit which may arise from reliance on any information supplied by TFA Global Pte Ltd.
The speaker(s) is neither an employee, agent nor representative of FXCM and is therefore acting independently. The opinions given are their own, constitute general market commentary, and do not constitute the opinion or advice of FXCM or any form of personal or investment advice. FXCM neither endorses nor guarantees offerings of third party speakers, nor is FXCM responsible for the content, veracity or opinions of third-party speakers, presenters or participants.

USDCHF Buy IDEAThe market is in a strong Bullish Trend and I am looking for my entry on fib levels 0.38 with risk to reward 1:1


USD-CHF Will Fall! Sell!
Hello,Traders!
USD-CHF was going up
In a strong uptrend but the
Pair is retesting a horizontal
Resistance of 0.9115 from
Where we are already seeing
A local bearish reaction so
We will be expecting a
Further move down
Sell!
Like, comment and subscribe to help us grow!
Check out other forecasts below too!

02-04-2024 _ Short Term Bullrish Idea _ USDCHF H1Range Breakout
Bullish Trending Structure
No Divergence Against
Hidden Divergence suggesting a move UP
Strong Green Bullish Candlestick
Instant Entry with Trade Plan as shown

USDCHFUSDCHF is in bullish trend.
Potentially printing HH and HL.
No sign of reversal here.
We wait and watch for the breakout of last HH.

USDCHF bullish chart using trend linesthis chart shows bullish trend for USDCHF on 1H time frame using trend lines
USDCHF - 4hrs ( Buy Trade Target Range 150 PIP ) 💵Pair Name USD/CHF
Time Frame : 4 hrs
Scale Type : line chart + Candle Stick
------
🔗 Key Technical / Direction ( Long )
Type : Mid Term Swing
——————————
Bullish Break
0.90750 Area
Reasons
- Major Turn level
- Pattern Break Out
- Choch Zone
- Day + W high
Bearish Reversal
0.92500 Area
Reasons
- Major Turn level
- Quarter High
- Pattern Target
- Fibo Golden Zone
- Ultra Volume
