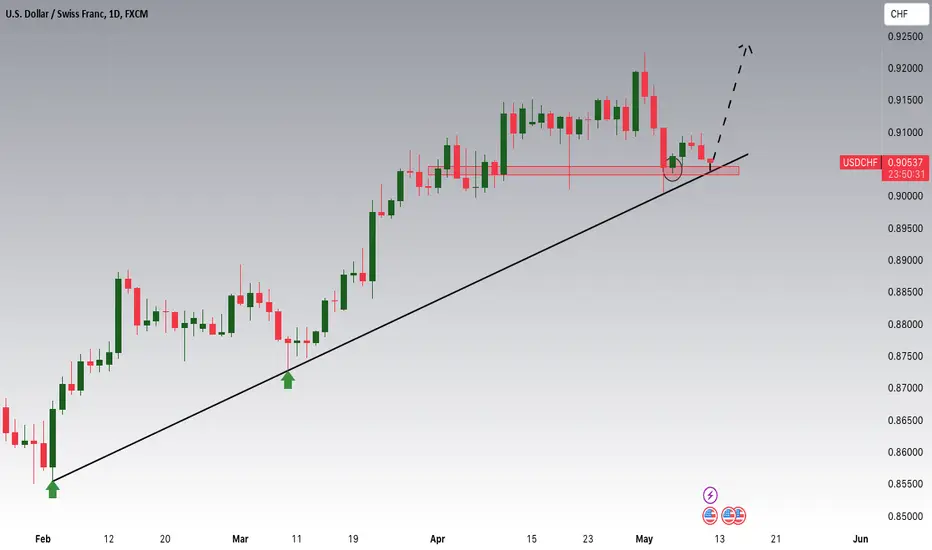
USDCHF going bullish next weekWith the prevailing uptrend on daily timeframe, expect a bullish USDCHF next week. Refer from the 1 hour timeframe trendline
CHFUSD trade ideas

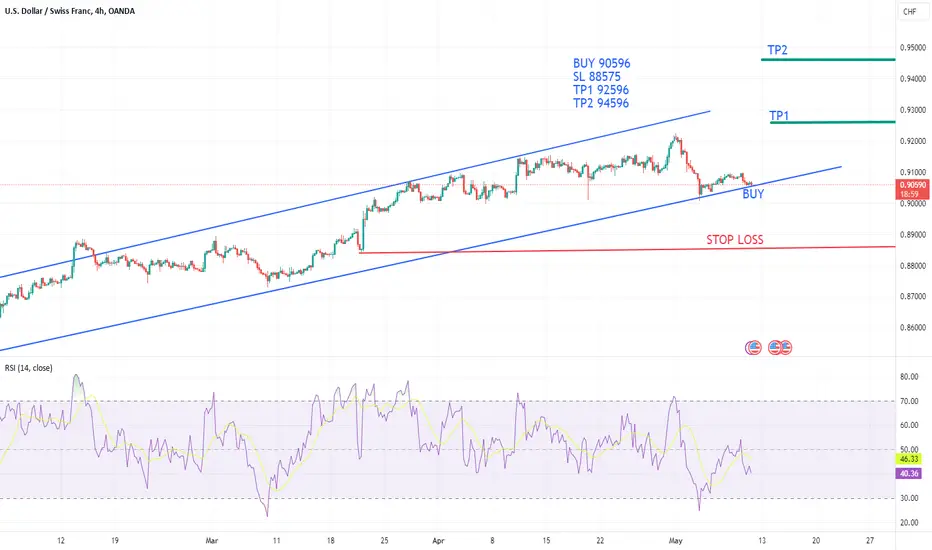
I bought USDCHF 0.9065I bought USDCHF 0.9065
Stoploss 0.9045 20 pip
Take profit 1.9195 130 pip
Ratio 1:6.5
Trade at your own risk and money management ..

USDCHF - Price can exit from pennant, and then start to growHi guys, this is my overview for USDCHF, feel free to check it and write your feedback in comments👊
Recently price entered to falling channel, where it first reached resistance level, which coincided with resistance area.
Then CHF bounced down from this level and fell to almost support line of channel, after which made upward impulse.
Swiss Franc exited from channel, broke $0.9155 level, and rose to $0.9220 points, but soon turned around and started to fall.
Also, price formed pennant pattern, where it declined to support line and soon bounced up, breaking $0.9050 level.
Later CHF reached resistance line of pennant, but recently CHF bounced down and declined to support line.
So, I think Swiss Franc can exit from pennant pattern and then bounce up from support level to $0.9120
If this post is useful to you, you can support me with like/boost and advice in comments❤️

USDCHF Will Move Lower! Sell!
Here is our detailed technical review for USDCHF.
Time Frame: 9h
Current Trend: Bearish
Sentiment: Overbought (based on 7-period RSI)
Forecast: Bearish
The market is on a crucial zone of supply 0.907.
The above-mentioned technicals clearly indicate the dominance of sellers on the market. I recommend shorting the instrument, aiming at 0.900 level.
P.S
We determine oversold/overbought condition with RSI indicator.
When it drops below 30 - the market is considered to be oversold.
When it bounces above 70 - the market is considered to be overbought.
Like and subscribe and comment my ideas if you enjoy them!

USDCHF Ascending triangleusdchf is making higher highs and in bullish trend currently its testing trend line good opportunity to buy at this level
USDCHF Channel Up intact. Aim higher.The USDCHF pair has been trading within a Channel Up pattern since the December 28 2023 Low. In the past 2 weeks, it has been forming its 2nd Bearish Leg that almost touched the 1D MA50 (blue trend-line), which has been supporting since February 02.
As long as we close 1D candles above it, we stay bullish, targeting 0.94200 (marginally below Resistance 2). Since however the recent Higher High was priced just below Resistance 1 (the October 03 2023 High), we will turn bearish (and take the buy's loss) if the pair closes a 1D candle below the 1D MA100 (green trend-line), which is what happened on November 14 2023. In that case, our Target will be 0.87350 (Support 1).
-------------------------------------------------------------------------------
** Please LIKE 👍, FOLLOW ✅, SHARE 🙌 and COMMENT ✍ if you enjoy this idea! Also share your ideas and charts in the comments section below! This is best way to keep it relevant, support us, keep the content here free and allow the idea to reach as many people as possible. **
-------------------------------------------------------------------------------
💸💸💸💸💸💸
👇 👇 👇 👇 👇 👇

Strifor || USDCHF-08/05/2024Preferred direction: SELL
Comment: Against the backdrop of a calm week on the economic calendar, the US dollar is trying to strengthen, but this is likely to change in the near future. We continue to consider short-term sell priority for the dollar. Considering the USDCHF currency pair, the most conservative is at the level of 0.91424 (scenario №1) . However, it is permissible to look for entry points into selling starting from the current ones. Also, as an alternative scenario, in the case of more aggressive behavior by buyers for this instrument, shorts will be considered after a false breakout of the level of 0.91424 (scenario №2).
Additional comments on this trade will be provided as situation changes. Follow us!
Thank you for like and share your views!

USDCHF-ABCD Bullish reversal forming on 1H time frameA good idea to enjoy a short sell and reversal at the same time trade formation.

USDCHF LongThe price is retesting the support area after a brief breakout from the demand area of the trend line, thus creating a higher low.
We can expect the price to continue trending higher to the demand zone at around $0.92

USD/CHF: Anticipating Further Bearish MovementHello Everyone,
The USD/CHF currency pair appears poised for further downward movement, with current conditions favoring continued bearish momentum.
TradeWithTheTrend3344

✅USD_CHF TIME TO SELL|SHORT🔥
✅USD_CHF made a retest
Of the risging resistance
Which used to be a rising
Support lone and we are
Already seeing a bearish
Reaction so a further
Move down is to be expected
SHORT🔥
✅Like and subscribe to never miss a new idea!✅

USDCHF is approaching the main daily tendHey Traders, in today's trading session we are monitoring USDCHF for a buying opportunity around 0.90400 zone, USDCHF is trading in an uptrend and currently is in a correction phase in which it is approaching the trend at 0.90400 support and resistance area.
Trade safe, Joe.
USD-CHF Will Go Down! Sell!
Hello,Traders!
USD-CHF broke the rising
Support line went down
Then up and has retested
The broken support from
Where we are already seeing
A bearish reaction so
We will be expecting
A further move down
Sell!
Like, comment and subscribe to help us grow!
Check out other forecasts below too!

USDCHF(Elliott waves)Hello friends
In the USDCHF currency pair, we see the formation of a 3-wave pattern.
In counting Elliott waves, these 3 waves are considered either a zigzag pattern or 3 waves out of 5 impulse waves.
Therefore, in both cases, there is a need to correct the price.
Now, considering the formation of a terminal triangle pattern in wave 3 or C, we consider the possibility of a zigzag formation more.
So the price should be reduced.
Currently, the price has broken a reliable support and made a pullback to it, which is a confirmation of this analysis. Therefore, we expect the price to decrease until the next support, which is at 0.8900.
In case of further decrease, the second price target is 0.8732.
To support me, I recommend that you install Trading View software on your phone and see my analysis and support me with your comments and Boost.
Be successful and profitable.

USDCHF SHORTThis is just simple trading idea draw into chart using labels and lines. Please use it as educational purpose and you are free to modify an


📉💼Trading Alert: USD/CHF Facing Resistance Turned Support!📊🔍📉💼 Trading Update: USD/CHF Analysis 💼📉
🔍 Keeping a keen eye on USD/CHF! 🔍
📉 The USD/CHF pair is currently testing a critical support-turned-resistance level after a recent breakout. This shift suggests a bearish confirmation, indicating potential downward pressure.
📊 On the hourly chart, we can spot a horizontal range, with the breach of its support signaling a bearish sentiment taking hold.
💡 Considering these technical cues, there's a chance that USD/CHF might aim for the 0.9070 level in the near term.
💬 Let's stay vigilant and see how this scenario unfolds! 💬
#TradingAnalysis #USDCHF #ForexMarket 📉💼🔍📊💡💬

USDCHF: Top-Down Analysis & Trading PlanThe USDCHF currency pair has broken and closed below an important intraday support level, which has now become resistance.
There is a retest of this broken structure happening, after the test of the support level of 0.9020.
To consider shorting the pair, look for a bearish flag pattern on the 4-hour timeframe as confirmation.
If there is a breakout below the bearish flag support with a 4-hour candle close, it will confirm the dominance of sellers.
A bearish trend is expected to continue towards the 0.9020 support level.

Reacting off pullback resistance?USD/CHF has just rejected off the pivot, which has been identified as a pullback resistance, and could reverse to the 1st support.
Pivot: 0.9094
1st Support: 0.9030
1st Resistance: 0.9151
Risk Warning:
Trading Forex and CFDs carries a high level of risk to your capital and you should only trade with money you can afford to lose. Trading Forex and CFDs may not be suitable for all investors, so please ensure that you fully understand the risks involved and seek independent advice if necessary.
Disclaimer:
The above opinions given constitute general market commentary, and do not constitute the opinion or advice of IC Markets or any form of personal or investment advice.
Any opinions, news, research, analyses, prices, other information, or links to third-party sites contained on this website are provided on an "as-is" basis, are intended only to be informative, is not an advice nor a recommendation, nor research, or a record of our trading prices, or an offer of, or solicitation for a transaction in any financial instrument and thus should not be treated as such. The information provided does not involve any specific investment objectives, financial situation and needs of any specific person who may receive it. Please be aware, that past performance is not a reliable indicator of future performance and/or results. Past Performance or Forward-looking scenarios based upon the reasonable beliefs of the third-party provider are not a guarantee of future performance. Actual results may differ materially from those anticipated in forward-looking or past performance statements. IC Markets makes no representation or warranty and assumes no liability as to the accuracy or completeness of the information provided, nor any loss arising from any investment based on a recommendation, forecast or any information supplied by any third-party.

USD/CHF H4 | Close to 38.2% Fibonacci resistanceUSD/CHF is trading close to a pullback resistance and could potentially reverse off this level to drop lower.
Sell entry is at 0.9095 which is a pullback resistance that aligns with the 38.2% Fibonacci retracement level.
Stop loss is at 0.9184 which is a level that sits above the 78.6% Fibonacci retracement level and an overlap resistance.
Take profit is at 0.9030 which is a pullback support that aligns with the 50.0% Fibonacci retracement level.
High Risk Investment Warning
Trading Forex/CFDs on margin carries a high level of risk and may not be suitable for all investors. Leverage can work against you.
Stratos Markets Limited (www.fxcm.com):
CFDs are complex instruments and come with a high risk of losing money rapidly due to leverage. 68% of retail investor accounts lose money when trading CFDs with this provider. You should consider whether you understand how CFDs work and whether you can afford to take the high risk of losing your money.
Stratos Europe Ltd, previously FXCM EU Ltd (www.fxcm.com):
CFDs are complex instruments and come with a high risk of losing money rapidly due to leverage. 70% of retail investor accounts lose money when trading CFDs with this provider. You should consider whether you understand how CFDs work and whether you can afford to take the high risk of losing your money.
Stratos Trading Pty. Limited (www.fxcm.com):
Trading FX/CFDs carries significant risks. FXCM AU (AFSL 309763), please read the Financial Services Guide, Product Disclosure Statement, Target Market Determination and Terms of Business at www.fxcm.com
Stratos Global LLC (www.fxcm.com):
Losses can exceed deposits.
Please be advised that the information presented on TradingView is provided to FXCM (‘Company’, ‘we’) by a third-party provider (‘TFA Global Pte Ltd’). Please be reminded that you are solely responsible for the trading decisions on your account. There is a very high degree of risk involved in trading. Any information and/or content is intended entirely for research, educational and informational purposes only and does not constitute investment or consultation advice or investment strategy. The information is not tailored to the investment needs of any specific person and therefore does not involve a consideration of any of the investment objectives, financial situation or needs of any viewer that may receive it. Kindly also note that past performance is not a reliable indicator of future results. Actual results may differ materially from those anticipated in forward-looking or past performance statements. We assume no liability as to the accuracy or completeness of any of the information and/or content provided herein and the Company cannot be held responsible for any omission, mistake nor for any loss or damage including without limitation to any loss of profit which may arise from reliance on any information supplied by TFA Global Pte Ltd.
The speaker(s) is neither an employee, agent nor representative of FXCM and is therefore acting independently. The opinions given are their own, constitute general market commentary, and do not constitute the opinion or advice of FXCM or any form of personal or investment advice. FXCM neither endorses nor guarantees offerings of third-party speakers, nor is FXCM responsible for the content, veracity or opinions of third-party speakers, presenters or participants.

USDCHF - Swing trade - 1:2.4 RRLooking to take a sells based off daily trendline break
Trendline has been broken, now waiting for a daily closure below the range.

USDCHF: Time to Sell?! 🇺🇸🇨🇭
USDCHF is currently testing a recently broken horizontal structure support,
that presumably turned into resistance after a breakout.
As a bearish confirmation, I see a horizontal range on an hourly time frame
and a bearish violation of its support.
I think that the price may drop soon to 0.9063
❤️Please, support my work with like, thank you!❤️

USDCHFIn the USD/CHF 4-hour timeframe, a bearish trend is emerging as the price completes a 38% retracement following a breakout from a rising wedge pattern. The subsequent formation of an ABC pattern suggests further downside potential. Traders may anticipate continued bearish momentum as the market adheres to this technical structure.
