✅BITCOIN BREAKOUT SHORT🔥
✅BITCOIN was trading in a rising wedge
But now we are seeing a bearish breakout
So I am bearish biased and I think
That the price will fall down
To retest the demand level below
SHORT🔥
✅Like and subscribe to never miss a new idea!✅
BTCG2019 trade ideas

MICRO BITCOIN FUTURES (MBT1!), H4 Potential for bullish riseType : Bullish Rise
Resistance : 27225
Pivot: 24315
Support : 22495
Preferred Case: On the H4, with price moving above the ichimoku indicator and within an ascending channel , we have a bullish bias that price will rise to the pivot at 24315 where the overlap resistance is. Once there is upside confirmation that price has broken pivot structure, we would expect bullish momentum to carry price to 1st resistance at 27225 where the 61.8% fibonacci retracement, -61.8% fibonacci expansion and 161.8% fibonacci extension are.
Alternative scenario: Alternatively, price could break drop to 1st support at 22495 where the overlap support, 61.8% fibonacci retracement and 78.6% fibonacci projection are.
Fundamentals: Due to the weakening chinese economy, we have a bearish view on Bitcoin. We'll need to exercise caution for this setup because our fundamentals and technicals are not completely aligned.

Consider it sold.Although I cant show my renko chart and strategy we are constantly rejecting the top resistance and if you look we have a major seller(s)(smart money) come in recently. We are headed down folks.

Bitcoin - For Trading Not for InvestingWhen Bitcoin was trading at around 60,000 level in late 2021 and before that year, whenever friends, acquaintance and participants asked my opinion about investing into cryptocurrency, immediately I knew they may not know much about cryptocurrency.
To clarify, I am not an expert in cryptocurrency, but I know its intrinsic value could not be calculated then and even today, therefore it is an instrument not for investing but for trading.
Let me elaborate, as long as we cannot define its intrinsic value to any so-call an asset, it is not an asset, but an instrument for trading.
When we get into trading, meaning, we have to acknowledge the getting in and out, out also represent to exit the market with either a profit or a loss, it is part of the deal in trading – we have to be quick when we make a wrong decision.
However, if you position yourself as an investor in crypto, you will either always perceive it will break new high or hope that it will someday go back to its former glory.
Throughout the whole tutorial, I will do a recap on how I have spotted this top here in November 2021. I have done this in another personal forum I have back then.
I will go through that and it may seem like a hindsight view, but I will apply the same strategy to the current market using just trendline and divergence.
Bitcoin Futures
Minimum Tick:
$5.00 = US$25
or $1.00 = US$5
Contract Value:
20,000 x US$5 = US$100,000
Disclaimer:
• What presented here is not a recommendation, please consult your licensed broker.
• Our mission is to create lateral thinking skills for every investor and trader, knowing when to take a calculated risk with market uncertainty and a bolder risk when opportunity arises.

BTC hit the min upside targetI think BTC hit its high over the weekend and now we should see some pullback and then one more push into 24500-28400 zone.
Also it doesn't have to stretch that high.
I'm still in the camp of this to hit 14.1-14.8k with ideal stretch to 11.8k and maybe lower.
I'm going to buy the 11k zone, might not come till Q1 of 2023, but this is the waiting game in it's own cycle.

🤖 #BTCLIVE - 15.08 - #IDEA 🤖 - Part 2🤖 #BTCLIVE - 15.08 - #IDEA 🤖 - Part 2
Just taking a slightly more macro look at the whole BTC status and we have a short term bearish rising wedge which we all know about although the longer term falling wedge is starting to come to a close. If we breakout of this falling wedge then we could be on for a massive push up - although break down on this rising wedge could bring alot of pain the next week is going to be very telling about a possible longer term expectation for #BTC


BTC crypto markets sorry to break it to you Crypto markets wont be going up anytime soon if we see the USD reassert its strength here coming into the fall

BTC ! Are we looking at a 6000 point rally Hi
Using the Volume Profile Tool I am trying to identify my supports and resistances on the 4 Hr time frame and find the following probability
We have broken a small resistance at the 23200 to 23700 area and also beginning to attempt a break out from a longer-term down-trending channel.
Though in its early stages, potentially we could have a test back to 23550/23700 areas and bounce from there.
The volume profile on the longer time frame shows an area of low volume until the 29500/30000 levels and that could be the path of least resistance
for the price to take. It could be a surprisingly brisk move if it decides to happen. Giving us a low-risk high probability trade setup.
The move next week should be interesting to watch
Cheers !!

BTC: MAX PAIN / FINAL COUNTDOWNTaking a closer look from the last chart:
1. LVA's are low volume areas and prices will typically travel faster through these
2. CME GAPs were made on the way down and are likely to be filled on the way back up.
3. 63D from bottom of last comparable bear flag to top suggests comparable time frame for this flag.
4. Last drop distance measured gives us a possible similar drop from current peice to abt 14,200 or when measured from the top of the range a drop to about 18k.
5. Drop to 18k is setup for a double bottom bounce pattern.
6. Drop to 14,200 is setup for another type of bottoming pattern, with longer projected date to bullish.
7. Thus, bounce range from this bear flag, and likely the last major drop before returning to bullishness, is 14,200 to 18k.
8. Note...we could stay at these levels and keep printing a bottoming pattern (double bottom or otherwise) then our range would be 18k- 25k (current) or 18k-29,500 (HVN)
All volume levels (HVN, LVA, VPOC) are based on weekly Volume Profile.
PS/Summary/TL;DR : MAX PAIN = 14,200 to 18,000, IMO. Dropping below 14,200 would invalidate wave #1 of the EW count. If this were to happen, Dan Pena would get his wish (BTC = $0 ) and the Saylor tower would crumble.

BTC ELLIOT WAVE & VOLUME STUDYJust a quick look where we are currently. 14,200 looks to be the max pain # from an EW perspective, so I would expect the bear flag we are in currently to conclude with a double bottom about 18,500 or another type bottoming pattern with LL above 14,200.

BTC KEY LEVELSWhether you are bullish or bearish, these levels are probably important to you in some way. They are to me.

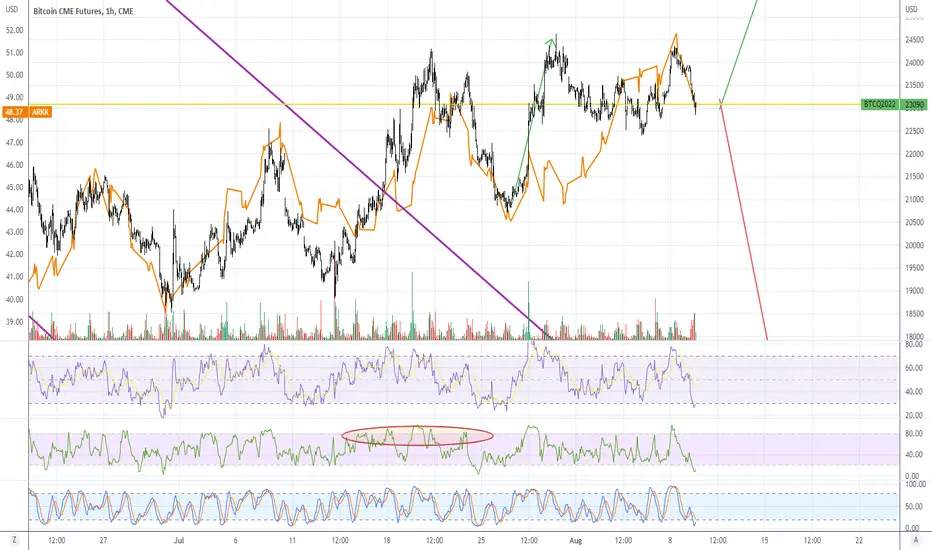
BTC - ARKK OverlayHere's what I mean when I say Bitcoin is tracking garbage stocks, the overlay is ARKK, Cathie Wood's garbage ETF.
This is an hourly chart, that's how close BTC has been tracking garbage.
BTW, Cathie Wood tends to chase after garbage, whatever you do don't buy her fund. You'd be better off randomly picking stocks yourself. Look at her portfolio before you buy that junk. ARKK is a sinking ship, lol.
CME Bitcoin Futures Breakout! 28,000 Next?From May12 - June 12, CME Bitcoin Futures saw a support level of ~28,000, which was broken on June 12 with a GAP lower.
We have recently seen a CONSOLODATION PENNANT, formed with higher lows, and lower highs!
Higher lows: ~18,500 June 30, ~18,830 July 13, ~20,700 July 26. The UPTREND line is drawn from ~18,830 to~20,700.
Lower highs: ~24,300 July20, ~23350 July 22, ~23,000 July 27. The DOWNTREND line is drawn from all 3.
The BREAKOUT occurred once the CME Bitcoin Futures broke through ~23,000!
How to measure upside potential after a BREAKOUT of a PENNANT:
Calculate the distance from the widest point, and add to the BREAKOUT point. This would give us ~28,800.
Why is ~28,800 significant? THIS WOULD FILL THE GAP MADE ON JUNE 12! GAPS tend to be filled before a market makes a pivot!
Takeaways:
Previous SUPPORT of ~28,000 is now new RESISTANCE. This is going to be a difficult level to chew through!
Possible STOP levels for longs:
~21,500 (continuation of UPTREND line of PENNANT.
~Uptrend will be violated if ~20,700 is broken with conviction. This would now be a lower low, which is the definition of a DOWNTREND.
FEEL FREE TO REACH OUT WITH ANY TECHNICAL ANALSYS OR FUTURES QUESTIONS!
WE APPRECIATE OUR FOLLOWERS! LIKE/COMMENT/FOLLOW! ❤️

Micro Bitcoin Futures (MBT1!), H4 Potential for Bullish Riseype : Bullish Rise
Resistance : 27225
Pivot: 24315
Support : 22395
Preferred Case: On the H4, with price moving within a bullish channel as well as above the ichimoku indicator and RSI moving along an ascending trendline, we have a bullish bias that price will rise to our pivot at 24315 where the overlap resistance is. Once there is upside confirmation that price has broken pivot structure, we would expect bullish momentum to carry price to 1st resistance at 27225 where the 61.8% fibonacci retracement , -61.8% fibonacci expansion and 161.8% fibonacci extension are.
Alternative scenario: Alternatively, price could drop to 1st support at 22395 where the pullback support, 61.8% fibonacci retracement and 61.8% fibonacci projection are.
Fundamentals: As BlackRock launches spot bitcoin private trust for US clients, we have a bullish view on Bitcoin .

Micro Bitcoin Futures (MBT1!), H4 Potential for Bullish RiseType : Bullish Rise
Resistance : 27225
Pivot: 24315
Support : 22395
Preferred Case: On the H4, with price moving within a bullish channel as well as above the ichimoku indicator and RSI moving along an ascending trendline, we have a bullish bias that price will rise to our pivot at 24315 where the overlap resistance is. Once there is upside confirmation that price has broken pivot structure, we would expect bullish momentum to carry price to 1st resistance at 27225 where the 61.8% fibonacci retracement, -61.8% fibonacci expansion and 161.8% fibonacci extension are.
Alternative scenario: Alternatively, price could drop to 1st support at 22395 where the pullback support, 61.8% fibonacci retracement and 61.8% fibonacci projection are.
Fundamentals: As BlackRock launches spot bitcoin private trust for US clients, we have a bullish view on Bitcoin.

BTC daily chart updateIn the daily chart, we can see that it is currently the rising wedge shape. If the price breaks upwards, pay attention to the first target range of 27577.61~28171.07.
This range also overlaps with the CME gap (the black line on the right chart marks the gap range, and the green line marks the first target range).
Prices generally tend to fill the CME gap. If the daily bar breaks above the wedge, it is possible to fill the CME gap.
-
The lower black rectangle on the daily chart is the support area.
-

Bitcoin 2022 till end of 2024heres my chart for bitcoin over the next while on this exchange----I have two setups maybe three I am trying to run for the next 5-8 years one is a public idea already----which came to the bottom of the gartley pattern over the next three years- then anti butterfly cypher ---on that chart- but we will see what happens----I always need a back up just in case----so this is my back up....

We got it right and BTC moved above 23,5K!!!! What to expect nowThe bull continue to set the tone. What would be a hint that they will lose it?

You didn't think it would be that easy did you?Bitcoin is looking like it'll probably want to retrace and fill in some gaps that it made in its recent run up. Nothing to worry about, regular behavior, but how long will it last? I'm thinking it could be up to a week. Could even be 1 day if I'm completely off but I'm going with a week. Afterwards we need to see how it reacts after filling the gaps, if there is a strong move back to the upside, 30k here we come.

BITCOIN Wait For Breakout! Buy!
Hello,Traders!
BITCOIN is trading in a bullish triangle pattern
So we are bullish biased on the coin
And IF we see a bullish breakout of the
Horizontal key level, then the bullish continuation
It to be expected
Buy!
Like, comment and subscribe to boost your trading!
See other ideas below too!

BTC almost ready to breakout, still have a little ways to goBTC had quite a run up in one hourly candle. Signs that it could be getting ready to run up to the first price target around 30k. Keep in mind that it has not broken out yet and can still consolidate and run stops if it sees fit.

MICRO BITCOIN FUTURES (MBT1!), H4 Potential for bullish riseType : Bullish Rise
Resistance : 24315
Pivot: 22430
Support : 20705
Preferred Case: On the H4, with price moving within a bullish channel and expected to bounce off the stochastic support, we have a bullish bias that price will rise from our pivot at 22430 where the pullback support, 61.8% fibonacci retracement and 78.6% fibonacci projection are to the 1st resistance at 24315 where the swing high resistance and 61.8% fibonacci projection are.
Alternative scenario: Alternatively, price could break pivot structure and drop to 1st support at 20705 where the swing low support, -61.8% fibonacci expansion and 100% fibonacci projection are.
Fundamentals: As investors are looking to reduce risk ahead of the CPI report, we have a bearish view on Bitcoin . We'll need to exercise caution for this setup because our fundamentals and technicals are not completely aligned.
