NQ potential for more upsideGood Morning Traders,
NQ looks primed for higher. if they push it over 14,200 and holds 13,750 range continuation to 1500 probable
MNQZ2021 trade ideas

THE BOTTOM IN THE NQ 100 OR MORE WEAKNESS TO COME?Key Developments:
The E-Mini Nasdaq 100 futures contract has had a rough month in April. Some of this correction was due to fears surrounding higher interest rates and persistent inflationary pressures. However, we believe most of the weakness had to do with other technology stocks that had reported earnings prior to META, GOOG, and MSFT.
ASML, a semiconductor company based in the Netherlands issued a murky global outlook for chip demand. Taiwan Semiconductor also provided softer-than-expected guidance. Softer guidance from these large AI players sparked some fear surrounding Mega-cap tech, and market participants priced in potential weakness to come.
However, the market received better-than-expected earnings from META, GOOG, and MSFT. GOOG and MSFT also issued better guidance. The outlook for AI and the massive amount of CapEx being spent to build AI infrastructure lifted the index notably higher last Friday's trade. NVDA rallied more than +6%, and GOOG finished higher by nearly +10%.
NVDA is the 3rd largest company by weight in the Nasdaq 100 index, and as more companies increase AI CapEx, NVDA stands to benefit and should keep the Nasdaq 100 elevated.
Despite slightly higher YoY PCE data on Friday, the MoM number came in as expected. Also, Michigan Consumer Sentiment fell slightly from the previous reading, and the 10yr Treasury Note rallied. As of now, the economy is still growing, and earnings expectations are exceeding estimates. It seems tech stocks may have bottomed in the near term.
Technicals:
As we can see, the 21-day Exponential Moving Average (EMA) and 50-day EMA have converged. If the 21-day manages to cross above the 50-day, this is technically bullish momentum, and we could see more upside for the E-Mini Nasdaq 100 futures.
Check out CME Group real-time data plans available on TradingView here: www.tradingview.com
Disclaimers:
CME Real-time Market Data help identify trading set-ups and express my market views. If you have futures in your trading portfolio, you can check out on CME Group data plans available that suit your trading needs www.tradingview.com
*Trade ideas cited above are for illustration only, as an integral part of a case study to demonstrate the fundamental concepts in risk management under the market scenarios being discussed. They shall not be construed as investment recommendations or advice. Nor are they used to promote any specific products, or services.
Futures trading involves substantial risk of loss and may not be suitable for all investors. Trading advice is based on information taken from trade and statistical services and other sources Blue Line Futures, LLC believes are reliable. We do not guarantee that such information is accurate or complete and it should not be relied upon as such. Trading advice reflects our good faith judgment at a specific time and is subject to change without notice. There is no guarantee that the advice we give will result in profitable trades. All trading decisions will be made by the account holder. Past performance is not necessarily indicative of future results.

All you should Know about Nasdaq (ICT)In fundamental analysis, we observe a market surge following a liquidity uptake beyond the all-time high, marking a new peak in NQ. However, inflation rates indicate that the Federal Reserve is hesitant to reduce interest rates. Even with a 5% interest rate, inflation is on the rise again. This suggests that the Fed may abandon the idea of lowering interest rates and maintain them at 5% until the year's end.
Nevertheless, last week witnessed positive outcomes from companies such as Tesla, Microsoft, and Google, which revitalized market sentiment and led to a resurgence. However, concerns linger regarding the possibility of the Fed raising interest rates by half point, which could pose challenges for the market.
In technical analysis, we observe the price targeting the sell side for Tuesday, February 30th, 2024, retracing to the gap on Monday, April 15th, 2024, above the equilibrium and within the premium, allowing new sellers to enter. The next target is the order block from Tuesday, January 16th, 2024.

NQ Power Range Report with FIB Ext - 4/29/2024 SessionCME_MINI:NQM2024
- PR High: 17877.25
- PR Low: 17852.50
- NZ Spread: 55.25
No significant economic calendar events
Climbing back to 18000
- Partial weekend gap fill
- Found inventory in 17850s
- Above Friday's high
Evening Stats (As of 12:35 AM)
- Weekend Gap: +0.16 (open < 17840)
- Gap 10/30 +0.47% (open < 14272)
- Session Open ATR: 302.43
- Volume: 23K
- Open Int: 247K
- Trend Grade: Bull
- From BA ATH: -4.1% (Rounded)
Key Levels (Rounded - Think of these as ranges)
- Long: 18675
- Mid: 18106
- Short: 16963
Keep in mind this is not speculation or a prediction. Only a report of the Power Range with Fib extensions for target hunting. Do your DD! You determine your risk tolerance. You are fully capable of making your own decisions.
BA: Back Adjusted
BuZ/BeZ: Bull Zone / Bear Zone
NZ: Neutral Zone

NQ Weekly Levels (Apr29-May3)Here are my levels for this the coming week. NQ had a sharp reversal last week bouncing 3.82% after trading down for 4 weeks in a row. Dispite the strong rally the risk of bearish continuation remains high. A rejection at the top of the 1st red box could easily send price into a compound corrective move down to the 200 sma and upward trendline. Much depends on the reaction to FOMC, NFP as well as the earnings reports from AAPL and AMZN.
SUMMARY
NQ posted a 3.83% gain last week after trading in a 753 pt range.
NQ made V-bottome reversal and closed back above the 9 ema just below the 2021 high.
R2 = LTF 618 Fib RT/55 ema (18082)
R1= 2021 High ( 17957)
S1 = 9 ema (17727)
S2= LTF 382 Fib RT (17705)
Bias is still down to sideways as upward trendline has been broken.
200 SMA price magnet in play
Compound corrective move down to 200 sma/lower trendline support is possible
FOMC Rate decision on Wed & Non-Farm Payrolls on Friday
Heavy week of earnings ahead including reports from AAPL, AMZN, MA, AMD, COIN & NET.
Global event risk is high
Sell in May effect in play.
RSI 47.37| VIX at 15.02 | 10 year 4.66%

More possible downside for NQPrice has moved for ERL(ATH) to IRL(Weekly Bullish OB) which created a MSS on the weekly time frame.
Price has retraced nicely off of the Weekly OB and is now entering premium of the current dealing range on the daily
- This week we will not trade on Monday as there is no news and will be expecting accumulation.
- If market sentiment has truly shifted I am expecting to see Monday accumulation, Tuesday to create the high of the week into that daily FVG, and then expansion lower to reach for previous weeks low.
- If that Daily FVG is violated I’ll be expecting ATH again.

NQ Aiming for All Time HighsNQ & ES Are looking Strong, And Respecting Bullish PD Arrays, And April usually having a Rally going into May, Am expecting NQ to hit All time Highs.

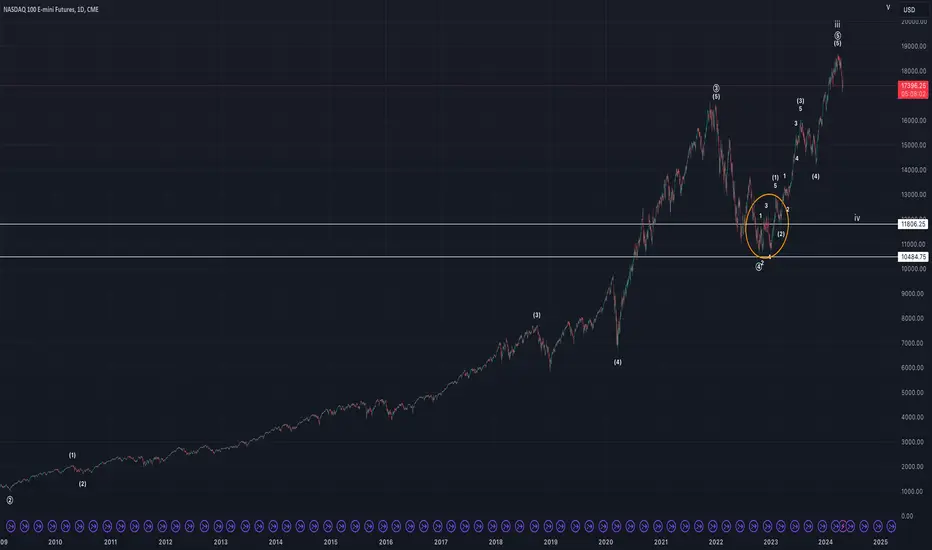
NQ1!, big pictureIf NQ1! has topped for primary wave iii of v, the top of 18709 tagged the 3.618 extension of i from ii and, at the same time, it tagged the 5.618 extension of (1) from (4). From a technical standpoint, it's a beautiful finish. I would think that 11806.25 would hold as support, but technically wave iv can finish anywhere above 4884.

Nasdaq: Support? Check! ✅The support at 17,372 points seems to be holding: Yesterday, the Nasdaq touched down on the red line once again, but immediately used it as a springboard for a further upward swing. This is good news for our primary scenario, as there is still a long way to go until the top of the magenta wave (i) is reached. If the Nasdaq continues to defend the 17,372-points mark so bravely, it will keep its distance from our (45% likely) alternative scenario of a new wave-alt.(ii) low in the blue Target Zone (coordinates: 16,424 – 15,118 points).

MNQ Mid-Week Outlook 4/24Gone private but still here grinding everyday.
Im expecting a weak NQ NAS NASDAQ NAS100 whatever you want to call it.
Short story is buyside purged and HTF bearish delivery. Long story is yet to be told via lower time frame price discovery expression. My bias is to the downside.
Target is a standard deviation of the opening price projected below the open price. That's a low hanging objective if price follows this narrative, however a run lower would not surprise me.

NQ Power Range Report with FIB Ext - 4/26/2024 SessionCME_MINI:NQM2024
- PR High: 17822.50
- PR Low: 17755.25
- NZ Spread: 150.0
Key economic calendar event
08:30 | Core PCE Price Index (2x)
Closed prev high with vol spike back to week highs
- Faded with strength at open from prev session high
- Holding inventory in 17740s
Evening Stats (As of 1:35 AM)
- Weekend Gap: N/A
- Gap 10/30 +0.47% (open < 14272)
- Session Open ATR: 309.22
- Volume: 30K
- Open Int: 256K
- Trend Grade: Bull
- From BA ATH: -4.9% (Rounded)
Key Levels (Rounded - Think of these as ranges)
- Long: 18675
- Mid: 18106
- Short: 16963
Keep in mind this is not speculation or a prediction. Only a report of the Power Range with Fib extensions for target hunting. Do your DD! You determine your risk tolerance. You are fully capable of making your own decisions.
BA: Back Adjusted
BuZ/BeZ: Bull Zone / Bear Zone
NZ: Neutral Zone

I`m still short bias on MNM4
On a recent post
I posted a trade I took at 18200 level on mnqm4
I`m still using this level again in confluence with the open of this down close candle on 1D chart and lows from previous weeks
This time I`m not betting the house
Risk on the trade 0.53% on a 100k account with Elite trader Funding

NQ1! morning updateMy count has wave 5 of 5 of primary wave 3 complete, primary wave 4 projected to complete towards October 2022 low of 10484.75. I'm looking at 11806.25 to be support for primary wave 4. Area in orange ellipse ends of being an expanding leading diagonal 1 of 5 of 3.
NQ Scalping Zones 4/25Zones have kept me safe no matter what news is coming out. All I focus on is my levels and trading within the ranges. Come join the team and bank!!


Nasdaq Analysis: Fibonacci Retracement and RSI DivergenceThe Nasdaq has reached an intriguing point around the 17200 area, where it sits at the 61.8% Fibonacci retracement level from the previous swing low. Price action appears to be responding to this level on lower timeframes, and we've also observed a divergence on the RSI indicator on the H4 timeframe, coinciding with the price attempting to move out of oversold conditions. We are considering a scalp position with a potential take profit at the 38.2% Fibonacci level, and possibly at the Point of Control (POC) Volume for an extended take profit.

NQ Power Range Report with FIB Ext - 4/25/2024 SessionCME_MINI:NQM2024
- PR High: 17486.75
- PR Low: 17437.25
- NZ Spread: 110.25
Key economic calendar events
08:30 | Initial Jobless Claims
- GDP
Strong inventory run to close prev session
- Mechanical print resulting in pivot back into 4/23 range
- Another technical session gap that structurally filled but left room to the close
- Full gap fill at 17509
Evening Stats (As of 12:05 AM)
- Weekend Gap: N/A
- Gap 10/30 +0.47% (open < 14272)
- Session Open ATR: 294.38
- Volume: 28K
- Open Int: 253K
- Trend Grade: Bull
- From BA ATH: -6.5% (Rounded)
Key Levels (Rounded - Think of these as ranges)
- Long: 18675
- Mid: 18106
- Short: 16963
Keep in mind this is not speculation or a prediction. Only a report of the Power Range with Fib extensions for target hunting. Do your DD! You determine your risk tolerance. You are fully capable of making your own decisions.
BA: Back Adjusted
BuZ/BeZ: Bull Zone / Bear Zone
NZ: Neutral Zone

NQ! .78 Fib RejectionOpen gap on ES1!, we knew it had to go lower. Thought the catalyst would be PCE friday but Meta earnings did it. I think they dont even look at earnings numbers, they just use the event and hit sell.
NQ! .78 fib rejection is a clear reversal signal imo. Expecting at least the .618.

NQ may go lower Based on this Gann chart which is quite telling of pivots we could see more downside than we have seen so far. Contradicts my MNQ chart and another NQ chart I posted but this is HTF and could signal more capitulation if there is no peace in the middle east.

MNQ at key level Gann says we're at a key horizontal level here. From the looks of it we could be dealing with a magnet - bears exhausted, bulls exhausted - I figure any excuse to push up or pull down around this pivot will play out. Earnings and economic catalysts likely to give us direction for the time being. Look to May 22nd for the next vertical pivot - we will get a clear direction in about a month and will see a trend form.

NQ bouncing key gann levels after maxing Believe we will end the week bullish as long as we hold this low from the open. We should retest the upper line within 3-5 days max. Cut on a 2h close below low presented here.

NQ - War On BuystopsSimilar to ES, NQ witnessed a massive sell off; close to 1000 handles meaning that if you had 1 contract running from last Thursday’s high and closed out at the bullish daily order block @ 1789.75, you would have booked close to $20,000. Many professional traders are trading with 5, 10, 15 contracts and yes, although taking profits is very important, I am sharing the general scope of how yearly wages can be made in a few days if our stay consistent and manage risk.
I want to see a continued selloff before intraday 1 hour buystops are ran on before considering a trade. Observing 17553.25.
My philosophy is simple...
Fortify Michael J Huddlestone's concepts that I have studied to consistently predict where the market is more likely to go.
This includes;
- Market Structure
- Buyside/Sellside Liquidity
- Order Blocks
- Liquidity Voids
- Fair Value Gaps
- Optimal Trade Entry
- Premium/Discount Array
- SIBI/BISI
- Many More!
The strategies mentioned here are some of many that I use to implement into my analysis and over time, with consistency I aim to achieve a high degree of accuracy in the markets with the foresight and understanding to assess what went wrong when my bias is negated.
Credits;
- Michael Joe HUDDLESTONE
- Shawn Lee POWELL
- Toray KORTAN
MNQ Reaction to daily zonePrice is reaction to a daily zone. Now I think, market will go for higher prices
