NQ Short IdeaEntered bear channel and at least a potential retest of demand zone. However could also be a diagonal upward. Look for lower highs and lower lows on the lower time frames (5,10,15,30) to confirm this trend.
NQU2017 trade ideas


daily price action after hour update - nasdaqGood evening and i hope you are well.
After yesterdays bear surprise (no new ath - big surprise), we got an expected inside bar on most daily charts. I expect another leg down this week, followed by more trading range price action (could chop before too though).
nasdaq
bull case: Bulls want to reverse the sell off from Tuesday and keep this a trading range at the highs. They are trading above the daily 20ema and market is therefore bullish. They also closed above 18000, which in itself is still extremely bullish. BTFD is still on, range is just smaller and no new daily ath.
bear case: Bears kept the market below 18160 which i think is an important price. They also closed below the open and below the 1h 20ema. Thy want a retest of the lows 17832 again and a close below the daily 20ema around 17900. They see the price action today as a bear flag and the selling pressure is actually there, compared to last week.
short term: neutral until ECB presser and Fridays NFP - will probably range between 17830 - 18200
medium-long term: same as dax - the weekly chart gives nothing but bullishness so higher prices are expected. my long term outlook stays bearish and i expect at least a -30% correction in 2024.
trade of the day: very tricky day. big sell spikes which got all stops but bulls kept buying until retest of yesterdays open - there was a double top on the 15m tf then and it was a good short around 18160. have to be humble on these days

NQ SellsMarket Maker Sell Model
We're In 2nd Stage Distribution ,
And we have Sellside Liquidity Resting.
Would like to take a short from that FVG .

NQ Premarket UpdateI guess I should've known they'd pump futures overnight because NQ hit oversold yesterday. Be careful holding anything overnight though, ECB meeting tomorrow premarket.
Probably just staying out, I think it's gonna be a whipsaw day


NAS/Futures ShortsClean (Order block) retest and rejection right before (Jolts & Fed Powell Speech) Continuation Into Prominent (Sell Side Liquidity)

TRADING JOURNAL - 3.6.20243.5 Initial AM Sell Setup Reference (Sell Stop Activated) - Morning Analysis based on ICT's 2022 Mentorship.

NQ today Hello there. high probability to fall the market today more than 80%, Don't forget that losing is part of the game CME_MINI:NQ1!

NQ Power Range Report with FIB Ext - 3/6/2024 SessionCME_MINI:NQH2024
- PR High: 17985.00
- PR Low: 17952.25
- NZ Spread: 73.0
08:15 | ADP Nonfarm Employment Change
10:00 | Fed Chair Powell Testifies
- JOLTs Job Openings
10:30 | Crude Oil Inventories
Huge inventory decline prev session
- Faded into daily 20 Keltner avg
- Inventory response off 2/28-29 lows
- above prev session close
Evening Stats (As of 12:15 AM)
- Weekend Gap: +0.08 (filled)
- Gap 10/30 +0.47% (open < 14272)
- Session Open ATR: 240.75
- Volume: 24K
- Open Int: 285K
- Trend Grade: Bull
- From BA ATH: -2.1% (Rounded)
Key Levels (Rounded - Think of these as ranges)
- Long: 18675
- Mid: 18106
- Short: 16963
Keep in mind this is not speculation or a prediction. Only a report of the Power Range with Fib extensions for target hunting. Do your DD! You determine your risk tolerance. You are fully capable of making your own decisions.
BA: Back Adjusted
BuZ/BeZ: Bull Zone / Bear Zone
NZ: Neutral Zone

Shorting NQ ATHLooking for NQ to make a low after 3/5/2024, push to a failed high around BAH and previous ATH and short to a lower Balance Area

NQ Range (03-05-24)Yellow arrow is range to watch and look for a break out. The white lines are KL's to use as targets or turn zones. KLOD is 18285 and under is Short. KL 17867 had the U Turn in O/N Pre Open, this one may be retested prior to a move back up. Friday appears to have been a drop/offset day and Monday did not continue the prop but stabilized the level (all day). I have attached 1/9/22 Post that was timely before the 30% plus drop, BTD/FOMO Forever and AI all you want until history repeats itself. I will update on Teams.

NQ UpdateNQ almost oversold on my 3 hr chart, gonna wait until tomorrow and go long I guess. AAPL is already oversold on daily as I pointed out yesterday.
Bought a handful of gold puts this morning just so I pay attention to the market, should shorted shitcoin instead, lol. SHorting TSLA would have been the right idea yesterday, I mentioned it and didn;t buy any puts. Oh well. And NET dropped pretty good, need to keep an eye on that one.
Expecting a reversal tomorrow, not sure about gap direction but DAX looks like it already reversed today, so we could see a gap up

TRADING JOURNAL - 3.5.2024Post 24 Hour Analysis - 3.4.2024 Initial AM Sell Setup - Morning Analysis based on ICT's 2022 Mentorship.

NQ - Trend Is Your FriendSimilar to ES, all time highs has been created.
Awaiting dollar to create lows which would give NQ strength to run through all time highs.
My philosophy is simple...
Fortify Michael J Huddlestone's concepts that I have studied to consistently predict where the market is more likely to go.
This includes;
- Market Structure
- Buyside/Sellside Liquidity
- Order Blocks
- Liquidity Voids
- Fair Value Gaps
- Optimal Trade Entry
- Premium/Discount Array
- SIBI/BISI
- Many More!
The strategies mentioned here are some of many that I use to implement into my analysis and over time, with consistency I aim to achieve a high degree of accuracy in the markets with the foresight and understanding to assess what went wrong when my bias is negated.
Credits;
- Michael Joe HUDDLESTONE
- Shawn Lee POWELL
- Toray KORTAN

NQIs this where the Nasdaq finally respects the black uptrend line/RSI divergences? Or does it still not matter?

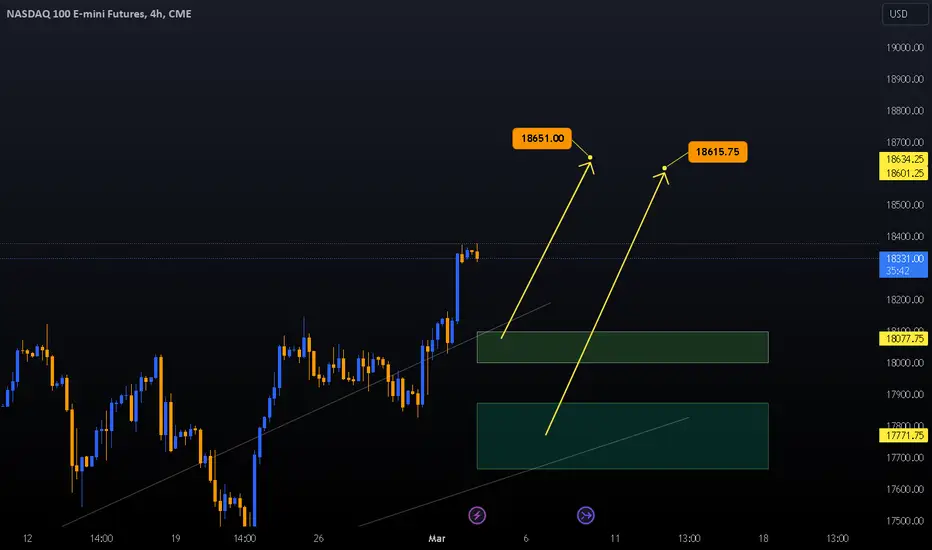
Nasdaq GO TO 18651 💣💣The Nasdaq is at the top and is continuing and ready to jump more again... We have a hot week for data in America, and any negative news for the dollar will be in favor of the Nasdaq to rise more. We also have NFP data on Wednesday and Friday, and the positivity of these data will be in favor of the Nasdaq and vice versa.
NQ Range (03-04-24)KLOD is 18335, look for NAZ to rotate 30 points above/below KLOD prior to break out. Pattern has been O/N drop (18312 O/N low) and pop into Open or near with O/R drop retest and sideways until Close. 18350-320 may be Open Range today. Friday Long play through Monday is also a pattern with sell off near or during Tuesday Reg Session. Orange Zones below are FA's and can be easy drop targets. Use MA's for entry/targets, I will update on Teams.

NQ Power Range Report with FIB Ext - 3/5/2024 SessionCME_MINI:NQH2024
- PR High: 18254.00
- PR Low: 18217.50
- NZ Spread: 81.5
No significant calendar events
Continuing inventory hunt below prev session close
- Mechanical response to PR-1, dip below
- Relatively avg vols to start session
- 50% area of Friday's range
Evening Stats (As of 12:15 AM)
- Weekend Gap: +0.08 (filled)
- Gap 10/30 +0.47% (open < 14272)
- Session Open ATR: 230.55
- Volume: 29K
- Open Int: 295K
- Trend Grade: Bull
- From BA ATH: -0.8% (Rounded)
Key Levels (Rounded - Think of these as ranges)
- Long: 18675
- Mid: 18106
- Short: 16963
Keep in mind this is not speculation or a prediction. Only a report of the Power Range with Fib extensions for target hunting. Do your DD! You determine your risk tolerance. You are fully capable of making your own decisions.
BA: Back Adjusted
BuZ/BeZ: Bull Zone / Bear Zone
NZ: Neutral Zone

NASDAQ 100, LongNASDAQ 100 finished in February 2024 with a record high of $18386.25 however the growth will continue after a structured retracement to the target support at $18121 between the 4hr EMA 20 and 50 and my target resistance is $18474.
Support: 18121
Resistance: 18474

NQ, Long Opportunity With Reduced RiskIn recent weeks, the Nasdaq has experienced a notable uptrend, largely propelled by positive earnings news from key companies within the index. This surge comes despite the Commitment of Traders (COT) showing only a slight and hesitant increase since the beginning of the year, hinting at market participants' growing interest in continuing this bullish trend.
Historically, the Nasdaq has shown a bearish seasonality across major time frames (5, 10, and 20 years), predicting a market bottom towards the end of the first week of March. Contrary to this statistical trend, the asset did not exhibit any signs of decline. Instead, it reached new historical highs, demonstrating significant relative strength compared to its historical records.
Risk indicators like the Value at Risk (VaR) and Downside Risk are currently indicating a reduced risk level compared to the annual averages of the indexes, suggesting a state of relative calm among investors. The VXN, the Nasdaq’s option volatility index akin to the S&P500's VIX, has been on a downtrend for months, recently stabilizing at the 17-point level, further signaling investor tranquility.
Volume indicators, including the Accumulation Distribution, On Balance Volume, and Price Volume Trend, all confirm the bullish trend without any divergences, suggesting that the current uptrend could continue into the future.
Despite these bullish signs, indicators like the SAFE HAVEN DEMAND and JUNK BOND DEMAND—reflecting the difference in 20-day stock and bond returns and the yield spread between junk bonds and investment-grade bonds—indicate a greed condition. This has pushed the sentiment fear and greed index into cautionary levels. However, overbought technical indicators do not currently signal an imminent correction, which would typically warrant caution.
From a price action perspective, the Nasdaq has been in a clear uptrend since the beginning of the year, consistently validating its support and resistance levels within an upward channel on the H4 timeframe.
Given these conditions, the strategy involves waiting for the price to reach the 18150 level, which represents a previous all-time high broken dramatically in recent sessions. If reached within the cyclical terms indicated by OmegaTools' Cycle Oscillator, this level should also coincide with the median line of the aforementioned channel, further acting as a support level for the price.
To optimize the trade, we should wait for price strength, rejecting closures below the indicated level, possibly using a more reactive indicator or observing the creation of bullish structures characterized by increasing highs and lows on lower timeframes.
This swing trading operation suggests a stop just above 18000 points, sheltering behind the last minimum internal structure. The take profit is more ambitious, aiming to ride the ongoing trend with a first partial target at historical highs around 18380 points, and a second, full closure target at the upper part of the mentioned channel when the price shows signs of weakness around 18600 points. This trade strategy boasts a reward-to-risk ratio of over 3.5, underlining the substantial potential for profit relative to the risk involved.
DISCLAIMER : This analysis is not financial advice. Investing in financial markets involves risks, including the potential loss of capital. Always conduct your own research and consider seeking advice from a financial advisor.

TRADING JOURNAL - 3.4.20243.4.2024 Post Lunch AM Buy Setup Update - Morning Analysis based on ICT's 2022 Mentorship.

Can the HOUSE capitalize on this NQ FIB SHORT...?CME_MINI:NQ1!
This is a projected Short that could happen based off the Daily FIB...Now here is what I see rock w/ me!
1) Price is currently trading around 127.20% Fib Level on the 4Hr TF....
* I want to see Price sweep the high and touch 141.40% pricing around ($18341.50) and then fall off a cliff!
2) If buyers can push price up & touch 141.40% Fib Level and then sellers step back in and drive price back down towards 127.70% Fib Level and even close underneath on both the 30&15m candle sticks then i'll be interested in going short. (If and when)
3) I want to see price close under ($18315.00) which will be considered a 1Hr CHoCh on both the 30&15m candles before I enter the market short targeting the unmitigated 4Hr Demand zone below or 100.00% Fib Level... Roughly around a 730 pt move... We can easily catch a solid 2.5-3R % Gain depending on your management system and STOPS!
**Also price needs to be trading underneath the Red V-Wap on the 1Hr TF as a last min. confirmation to enter SHORT...
4) Remember nothing is set in stone...These are just my projections & we play the longterm game of 'PROBABILITY' in our favor and let me tell you, I am very confident in my reading of PA...
***This is how we eat!!
***Stay Dedicated, Stay Focused...Its time!
Now Let's sit back N stalk like the saltwater CROC!!
#BHM500K #NewERA
