NQ Aiming for All Time HighsNQ & ES Are looking Strong, And Respecting Bullish PD Arrays, And April usually having a Rally going into May, Am expecting NQ to hit All time Highs.
NQM2021 trade ideas

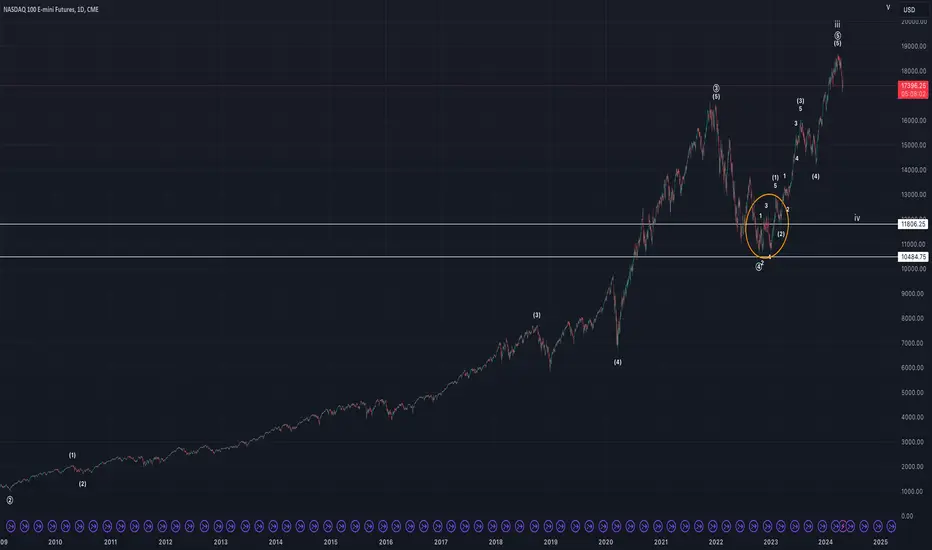
NQ1!, big pictureIf NQ1! has topped for primary wave iii of v, the top of 18709 tagged the 3.618 extension of i from ii and, at the same time, it tagged the 5.618 extension of (1) from (4). From a technical standpoint, it's a beautiful finish. I would think that 11806.25 would hold as support, but technically wave iv can finish anywhere above 4884.

Nasdaq: Support? Check! ✅The support at 17,372 points seems to be holding: Yesterday, the Nasdaq touched down on the red line once again, but immediately used it as a springboard for a further upward swing. This is good news for our primary scenario, as there is still a long way to go until the top of the magenta wave (i) is reached. If the Nasdaq continues to defend the 17,372-points mark so bravely, it will keep its distance from our (45% likely) alternative scenario of a new wave-alt.(ii) low in the blue Target Zone (coordinates: 16,424 – 15,118 points).

MNQ Mid-Week Outlook 4/24Gone private but still here grinding everyday.
Im expecting a weak NQ NAS NASDAQ NAS100 whatever you want to call it.
Short story is buyside purged and HTF bearish delivery. Long story is yet to be told via lower time frame price discovery expression. My bias is to the downside.
Target is a standard deviation of the opening price projected below the open price. That's a low hanging objective if price follows this narrative, however a run lower would not surprise me.

NQ Power Range Report with FIB Ext - 4/26/2024 SessionCME_MINI:NQM2024
- PR High: 17822.50
- PR Low: 17755.25
- NZ Spread: 150.0
Key economic calendar event
08:30 | Core PCE Price Index (2x)
Closed prev high with vol spike back to week highs
- Faded with strength at open from prev session high
- Holding inventory in 17740s
Evening Stats (As of 1:35 AM)
- Weekend Gap: N/A
- Gap 10/30 +0.47% (open < 14272)
- Session Open ATR: 309.22
- Volume: 30K
- Open Int: 256K
- Trend Grade: Bull
- From BA ATH: -4.9% (Rounded)
Key Levels (Rounded - Think of these as ranges)
- Long: 18675
- Mid: 18106
- Short: 16963
Keep in mind this is not speculation or a prediction. Only a report of the Power Range with Fib extensions for target hunting. Do your DD! You determine your risk tolerance. You are fully capable of making your own decisions.
BA: Back Adjusted
BuZ/BeZ: Bull Zone / Bear Zone
NZ: Neutral Zone

I`m still short bias on MNM4
On a recent post
I posted a trade I took at 18200 level on mnqm4
I`m still using this level again in confluence with the open of this down close candle on 1D chart and lows from previous weeks
This time I`m not betting the house
Risk on the trade 0.53% on a 100k account with Elite trader Funding

NQ1! morning updateMy count has wave 5 of 5 of primary wave 3 complete, primary wave 4 projected to complete towards October 2022 low of 10484.75. I'm looking at 11806.25 to be support for primary wave 4. Area in orange ellipse ends of being an expanding leading diagonal 1 of 5 of 3.
NQ Scalping Zones 4/25Zones have kept me safe no matter what news is coming out. All I focus on is my levels and trading within the ranges. Come join the team and bank!!


Nasdaq Analysis: Fibonacci Retracement and RSI DivergenceThe Nasdaq has reached an intriguing point around the 17200 area, where it sits at the 61.8% Fibonacci retracement level from the previous swing low. Price action appears to be responding to this level on lower timeframes, and we've also observed a divergence on the RSI indicator on the H4 timeframe, coinciding with the price attempting to move out of oversold conditions. We are considering a scalp position with a potential take profit at the 38.2% Fibonacci level, and possibly at the Point of Control (POC) Volume for an extended take profit.

NQ Power Range Report with FIB Ext - 4/25/2024 SessionCME_MINI:NQM2024
- PR High: 17486.75
- PR Low: 17437.25
- NZ Spread: 110.25
Key economic calendar events
08:30 | Initial Jobless Claims
- GDP
Strong inventory run to close prev session
- Mechanical print resulting in pivot back into 4/23 range
- Another technical session gap that structurally filled but left room to the close
- Full gap fill at 17509
Evening Stats (As of 12:05 AM)
- Weekend Gap: N/A
- Gap 10/30 +0.47% (open < 14272)
- Session Open ATR: 294.38
- Volume: 28K
- Open Int: 253K
- Trend Grade: Bull
- From BA ATH: -6.5% (Rounded)
Key Levels (Rounded - Think of these as ranges)
- Long: 18675
- Mid: 18106
- Short: 16963
Keep in mind this is not speculation or a prediction. Only a report of the Power Range with Fib extensions for target hunting. Do your DD! You determine your risk tolerance. You are fully capable of making your own decisions.
BA: Back Adjusted
BuZ/BeZ: Bull Zone / Bear Zone
NZ: Neutral Zone

NQ! .78 Fib RejectionOpen gap on ES1!, we knew it had to go lower. Thought the catalyst would be PCE friday but Meta earnings did it. I think they dont even look at earnings numbers, they just use the event and hit sell.
NQ! .78 fib rejection is a clear reversal signal imo. Expecting at least the .618.

NQ may go lower Based on this Gann chart which is quite telling of pivots we could see more downside than we have seen so far. Contradicts my MNQ chart and another NQ chart I posted but this is HTF and could signal more capitulation if there is no peace in the middle east.

MNQ at key level Gann says we're at a key horizontal level here. From the looks of it we could be dealing with a magnet - bears exhausted, bulls exhausted - I figure any excuse to push up or pull down around this pivot will play out. Earnings and economic catalysts likely to give us direction for the time being. Look to May 22nd for the next vertical pivot - we will get a clear direction in about a month and will see a trend form.

NQ bouncing key gann levels after maxing Believe we will end the week bullish as long as we hold this low from the open. We should retest the upper line within 3-5 days max. Cut on a 2h close below low presented here.

NQ - War On BuystopsSimilar to ES, NQ witnessed a massive sell off; close to 1000 handles meaning that if you had 1 contract running from last Thursday’s high and closed out at the bullish daily order block @ 1789.75, you would have booked close to $20,000. Many professional traders are trading with 5, 10, 15 contracts and yes, although taking profits is very important, I am sharing the general scope of how yearly wages can be made in a few days if our stay consistent and manage risk.
I want to see a continued selloff before intraday 1 hour buystops are ran on before considering a trade. Observing 17553.25.
My philosophy is simple...
Fortify Michael J Huddlestone's concepts that I have studied to consistently predict where the market is more likely to go.
This includes;
- Market Structure
- Buyside/Sellside Liquidity
- Order Blocks
- Liquidity Voids
- Fair Value Gaps
- Optimal Trade Entry
- Premium/Discount Array
- SIBI/BISI
- Many More!
The strategies mentioned here are some of many that I use to implement into my analysis and over time, with consistency I aim to achieve a high degree of accuracy in the markets with the foresight and understanding to assess what went wrong when my bias is negated.
Credits;
- Michael Joe HUDDLESTONE
- Shawn Lee POWELL
- Toray KORTAN
MNQ Reaction to daily zonePrice is reaction to a daily zone. Now I think, market will go for higher prices

2024-04-24 - a daily price action after hour update - nasdaq
Good Evening and I hope you are well.
overall market comment
Bulls got excited again and calling for new all time highs after a 3 week selloff. Well today was the expected disappointment for the bulls, after euphoric bears got disappointed last week. That’s what markets do after wild moves. No one knows where it’s going and market is looking for the fair price (average price if you will). It’s reasonable to expect more sideways movement before another trend up or down (I do think bears are heavily favored).
nasdaq e-mini futures
comment: after hours puke is freaking amazing.
current market cycle: trading range
key levels: 17200 - 17800
bull case: Bulls tried their best today to keep this a trading range above 17600 but after hours is puking bad. 17800 was a reasonable spot for a pull back and also good to take profits or get rid of underwater longs from late bulls. They have to keep the market above 17500 or 17400 is probably next again. On the daily they could get a second leg up for another test of the daily 20ema around 17900, which then would also form a reasonably good looking bear channel. Interesting end of the week tomorrow and probably signal bar going into next week.
bear case: When in doubt, zoom out. Daily chart tells the story better than lower time frames. I have drawn the wave thesis 2h before us close and boi did that hit. Painting says it better than my words can. I expect another retest of the lows, then another lower high to form a two legged pull back on the daily chart before we sell off for w3.
short term: Sideways to down - Invalid above 17700. Targets below 17400 and then 17200
medium-long term: Same as sp500 - Clear start of the new bear trend. Will cover this with wave thesis and targets in weekly outlook.
trade of the day: Big liquidity grap bar 34+35 got me stopped out but I’m stubborn and got back in. Caught the big move down. One had to get short latest below bar 39.
Sorry for the chart picture but I have no idea why tradingview wont render it properly in the posted idea - so had to insert screenshot

NQ1! morning updateI'm looking at price action from ATH as having completed an impulse wave down to 17181.75, with an expanded flat corrective wave (area in orange ellipse), likely to complete today. Wave C (bulls, green) or wave 3 (bears, red) should be another impulse wave down below low of 17113.25.


NQ remains relatively stronger to ESSpreader's delight. the Long NQ, Short ES spread continues to work in favor of the tech bulls.

NQ Power Range Report with FIB Ext - 4/24/2024 SessionCME_MINI:NQM2024
- PR High: 17698.50
- PR Low: 17664.00
- NZ Spread: 77.0
Key economic calendar events
08:30 | Durable Goods Orders
10:30 | Crude Oil Inventories
Daily gap up print of ~65 points, 0.35% from prev close
- Climbing above prev session high
- Inside lows of 4/17 range
Evening Stats (As of 12:05 AM)
- Weekend Gap: N/A
- Gap 10/30 +0.47% (open < 14272)
- Session Open ATR: 295.59
- Volume: 30K
- Open Int: 254K
- Trend Grade: Bull
- From BA ATH: -5.1% (Rounded)
Key Levels (Rounded - Think of these as ranges)
- Long: 18675
- Mid: 18106
- Short: 16963
Keep in mind this is not speculation or a prediction. Only a report of the Power Range with Fib extensions for target hunting. Do your DD! You determine your risk tolerance. You are fully capable of making your own decisions.
BA: Back Adjusted
BuZ/BeZ: Bull Zone / Bear Zone
NZ: Neutral Zone

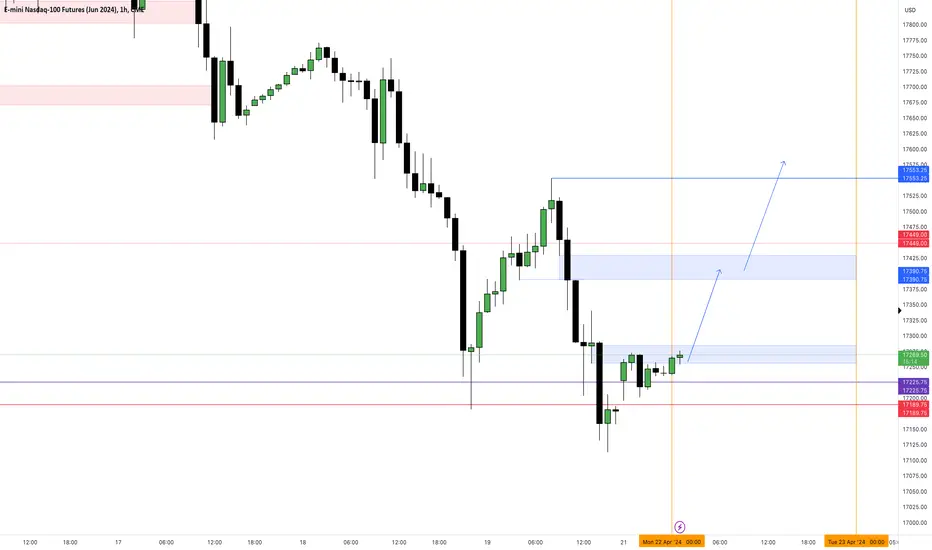
Idea from FVG on M5 to Relative Equal Highs Idea from FVG on M5 to Relative Equal Highs
Price reached order block on weekly. We may see some measure of retracement.
