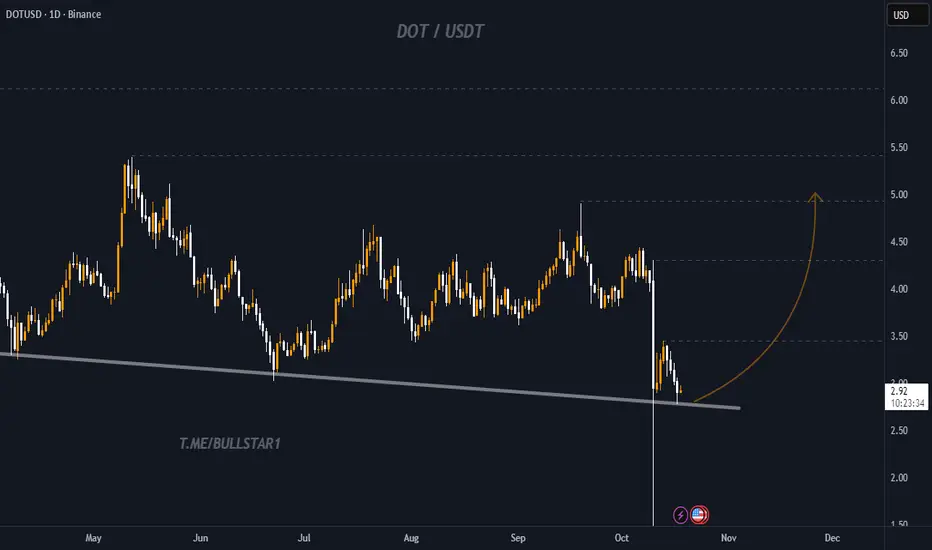
DOT / USDT – Retesting Long-Term Support | Potential Reversal AhPolkadot (DOT) is currently retesting a key long-term ascending support trendline that has held since early 2024. After a strong correction and liquidity sweep below recent lows, the price is showing signs of stabilizing around the $2.80–$3.00 area.
This zone has historically acted as a strong dema
Key facts today
Key stats
About Polkadot
Launched in 2020, Polkadot is sometimes described as a ‘layer-0’ blockchain as it hosts an ecosystem of blockchains. It’s a ‘parachain’ protocol — which, put simply, means it allows for ease of communication between separate cryptocurrencies. Founder Dr. Gavin Wood (formerly the CTO of Ethereum) sees Polkadot as synonymous with the web3 and its decentralized makeup, which is pretty unsurprising given he literally coined the term in 2014. Its native token DOT is used for staking, governance, and ‘bonding’ — the act of bonding DOT tokens with new chains on the network.
Related coins
POLKADOT spring set upPolkadot has currently started phase C (SPRING) of the Accumulation: Wyckoff Events schematic #1

DOTUSD | Bearish Rejection at Overlap ResistanceDOT/USD is rising towards the sell entry, which is an overlap resistance and could reverse from this level to the downside.
Sell entry is at 3.065, which is an overlap resistance.
Stop loss is at 3.277, which is a swing high resistance that aligns with the 161.8% Fibonacci extension.
Take profit

DOTUSD le flagJust because I got minimwlly rekt by that slip it closes above the orange support and gives a clear bullish future
NOT FINANCIAL ADVICE
Polkadot: Short-Term Rally Before Potential Drop into Target ZonDOT is currently expected to move toward the high of wave iv in orange, according to our primary scenario. We continue to anticipate that this move will remain below the resistance level at $3.78. Afterward, we are primarily preparing for a wave v sell-off into the orange Target Zone ($1.66 – $0.70)

Polkadot is the FUTURE Hi everyone
The pic is talking to us. Polkadot has big holders. Faithful and believed ones.
Keeping the bottom for almost 3 years and still resisting it.
I am sure that it is the one cryptocurrency you will never find to hold anymore soon.

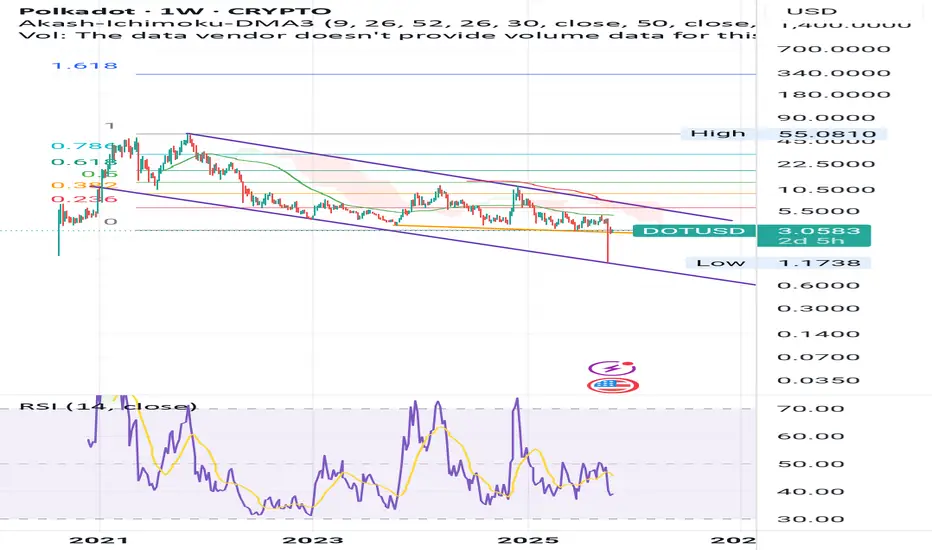
DOTUSD Can this Channel save it from complete obsolescence?Polkadot (DOTUSD) has been trading within a Channel Down since the December 26 2022 Low and it only broke momentarily during last Friday's flash crash. Having recovered instantly above it and closing the 1W candle inside the pattern, it technically counts as a Lower Low.
The last two Lower Lows (bo

DOT's situation+next targets and expected movementsThe price on the daily timeframe is within an ascending triangle, which can be promising. If the price breaks this pattern with bullish candles, it could easily rise by the distance of AB=CD, If my view is correct, DOT will rise to $5 .
And if this pattern is correct and breaks, higher targets are p

DOT is one of the most difficult projects to chart in the top 50DOT is one of the most difficult projects to chart in the top 50, DOT is still making lower lows.
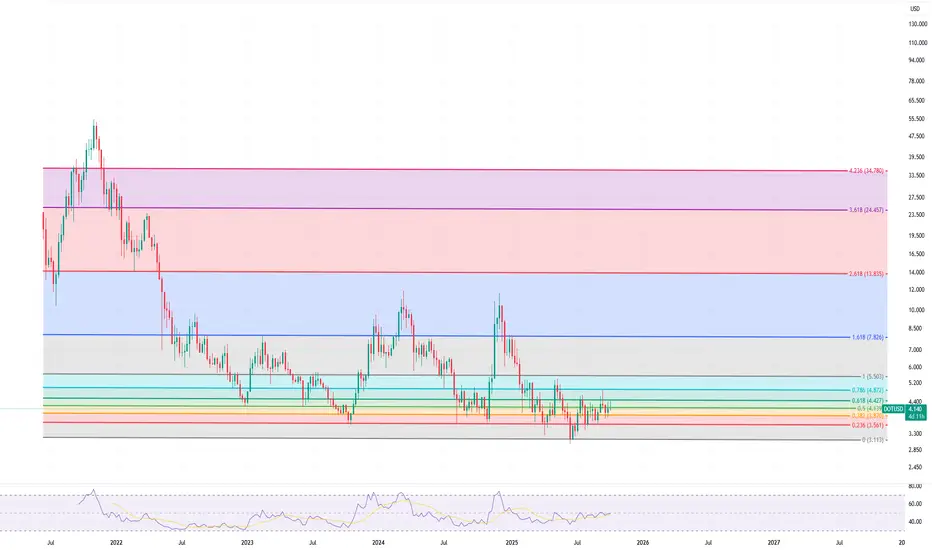
$DOT \ PolkadotCRYPTOCAP:DOT \ Polkadot 🔃
Polkadot has been accumulating for a long time in both USD and CRYPTOCAP:BTC pairs and is gathering strength above the demand zone.
With the RSI supporting this movement, DOT is preparing for a new upward phase. The sleeping giant, which has been quiet for a long tim

See all ideas
Summarizing what the indicators are suggesting.
Oscillators
Neutral
SellBuy
Strong sellStrong buy
Strong sellSellNeutralBuyStrong buy
Oscillators
Neutral
SellBuy
Strong sellStrong buy
Strong sellSellNeutralBuyStrong buy
Summary
Neutral
SellBuy
Strong sellStrong buy
Strong sellSellNeutralBuyStrong buy
Summary
Neutral
SellBuy
Strong sellStrong buy
Strong sellSellNeutralBuyStrong buy
Summary
Neutral
SellBuy
Strong sellStrong buy
Strong sellSellNeutralBuyStrong buy
Moving Averages
Neutral
SellBuy
Strong sellStrong buy
Strong sellSellNeutralBuyStrong buy
Moving Averages
Neutral
SellBuy
Strong sellStrong buy
Strong sellSellNeutralBuyStrong buy
Displays a symbol's price movements over previous years to identify recurring trends.
Curated watchlists where DOTUSD is featured.

Gen 3 crypto: A new day dawns…
25 No. of Symbols

Interoperability Crypto: Communication station
14 No. of Symbols

Polkadot Ecosystem: Spot the best
19 No. of Symbols

Proof of Stake: Seeking validation?
26 No. of Symbols

Smart contracts: Make the smart decision
36 No. of Symbols

Staking Coins: Pick up a stake
18 No. of Symbols

Top altcoins: Choose your alternatives carefully
28 No. of Symbols
See all sparks
Frequently Asked Questions
The current price of Polkadot (DOT) is 2.901 USD — it has risen 1.78% in the past 24 hours. Try placing this info into the context by checking out what coins are also gaining and losing at the moment and seeing DOT price chart.
The current market capitalization of Polkadot (DOT) is 4.73 B USD. To see this number in a context check out our list of crypto coins ranked by their market caps or see crypto market cap charts.
Polkadot (DOT) trading volume in 24 hours is 347.32 M USD. See how often other coins are traded in this list.
Polkadot price has fallen by −2.73% over the last week, its month performance shows a −25.27% decrease, and as for the last year, Polkadot has decreased by −30.90%. See more dynamics on DOT price chart.
Keep track of coins' changes with our Crypto Coins Heatmap.
Keep track of coins' changes with our Crypto Coins Heatmap.
Polkadot (DOT) reached its highest price on Nov 4, 2021 — it amounted to 55.134 USD. Find more insights on the DOT price chart.
See the list of crypto gainers and choose what best fits your strategy.
See the list of crypto gainers and choose what best fits your strategy.
Polkadot (DOT) reached the lowest price of 2.774 USD on Oct 17, 2025. View more Polkadot dynamics on the price chart.
See the list of crypto losers to find unexpected opportunities.
See the list of crypto losers to find unexpected opportunities.
The current circulating supply of Polkadot (DOT) is 1.63 B USD. To get a wider picture you can check out our list of coins with the highest circulating supply, as well as the ones with the lowest number of tokens in circulation.
The safest choice when buying DOT is to go to a well-known crypto exchange. Some of the popular names are Binance, Coinbase, Kraken. But you'll have to find a reliable broker and create an account first. You can trade DOT right from TradingView charts — just choose a broker and connect to your account.
Crypto markets are famous for their volatility, so one should study all the available stats before adding crypto assets to their portfolio. Very often it's technical analysis that comes in handy. We prepared technical ratings for Polkadot (DOT): today its technical analysis shows the sell signal, and according to the 1 week rating DOT shows the sell signal. And you'd better dig deeper and study 1 month rating too — it's sell. Find inspiration in Polkadot trading ideas and keep track of what's moving crypto markets with our crypto news feed.
Polkadot (DOT) is just as reliable as any other crypto asset — this corner of the world market is highly volatile. Today, for instance, Polkadot is estimated as 2.02% volatile. The only thing it means is that you must prepare and examine all available information before making a decision. And if you're not sure about Polkadot, you can find more inspiration in our curated watchlists.
You can discuss Polkadot (DOT) with other users in our public chats, Minds or in the comments to Ideas.