GOLD FUTURES Stock Chart Fibonacci Analysis 042423Trading Idea
1) Find a FIBO slingshot
2) Check FIBO 61.80% level
3) Entry Point > 2002/61.80%
GCM2026 trade ideas

Gold Exiting Sage-1 Setup - Moving Into BreakawayHave you been following my research?
My research and application of Technical Analysis is different than most others. I use techniques that align price action with advanced Price Energy cycles/waves.
I still use traditional Technical Analysis - but my application of the data is vastly different than most others. I've been doing this for more than 25+ years.
I see only two opportunities for #Gold Buyers to take action below the HKEX:2000 price level - right now, and December 2023 ~ March 2024. After that, you won't see the $2k level again (possibly) until after 2035.
If you are a goldbug or invest, buy, or trade Gold - follow my research.
Watch how price plays out and aligns with my research. I may be off by a few weeks in some areas - but I believe this is the most logical long-term Gold forecast you will find anywhere on the planet.
Please post your comments and leave feedback.
Time to prepare for the biggest gold trade of your LIFE. It's setting up right now.

Gold resistance - testing back below 2klast week was the first weekly close below 2k in GC since the recent breakout. Weekly chart highlights the multi-year range, big question is whether sellers have enough to re-take control of near-term trends this week. I don't doubt that Gold can prod a lasting move above 2k, I just don't think that'll happen until the Fed pivots and I'm not expecting that while Core CPI > 5%.
Am tracking a series of resistance levels overhead, 2008 near-term, 2023 above that. 2037, 2049 above that
supports 1980, 1954 and then 1944
next week is FOMC and ECB

Gold is on down impulse wave or notFlat correction going to finish soon?
I hope 3th down wave is coming soon
also this point is support becomes resistance

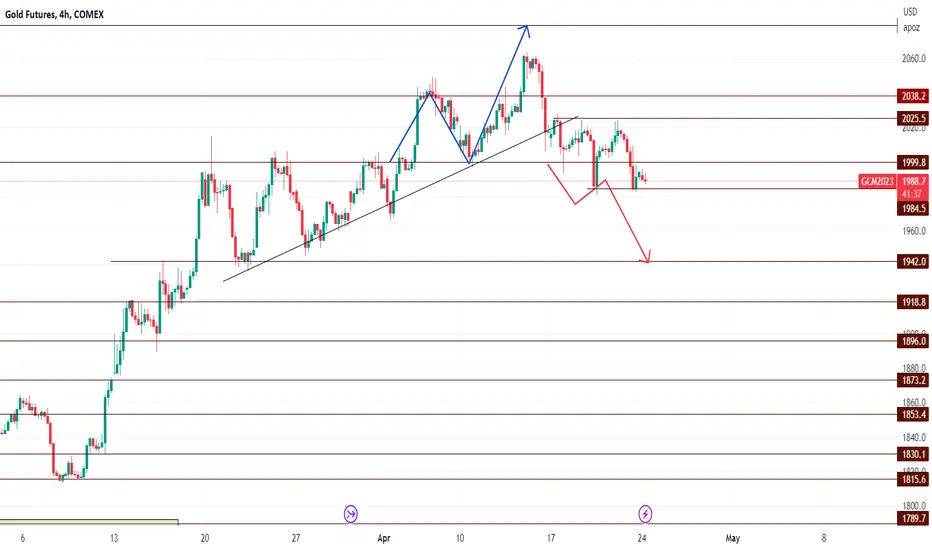
Gold strongly correlated to the DollarGold trades in consolidation between the 1985 and 2025 region throughout the week.
A breakout of the 2025 resistance region can push price towards 2080 while a breakout of the 1980 support region can push price towards the 1942.
Gold analysis - daily chart Slowly getting there
Monthly suggests moving higher to complete move up from 1999
Weekly while below 2078 could see a deeper correction before the next retest higher
Daily showing the first wave of a move higher so now we need to monitor the 2078 weekly high and possible topping pattern in daily to measure momentum.

Bias more on downside For Gold after hitting 2000+ resistance. 22th April
Gold - Support 1970/80
Break below 1970 = shall see 1920.
Immediate resistance - 2025

GCM3 High: 2060.00 Low: 1983.00 SidewaysWeekly Kickoff levels are longer timeframe levels where we believe longer time traders will adjust inventories.


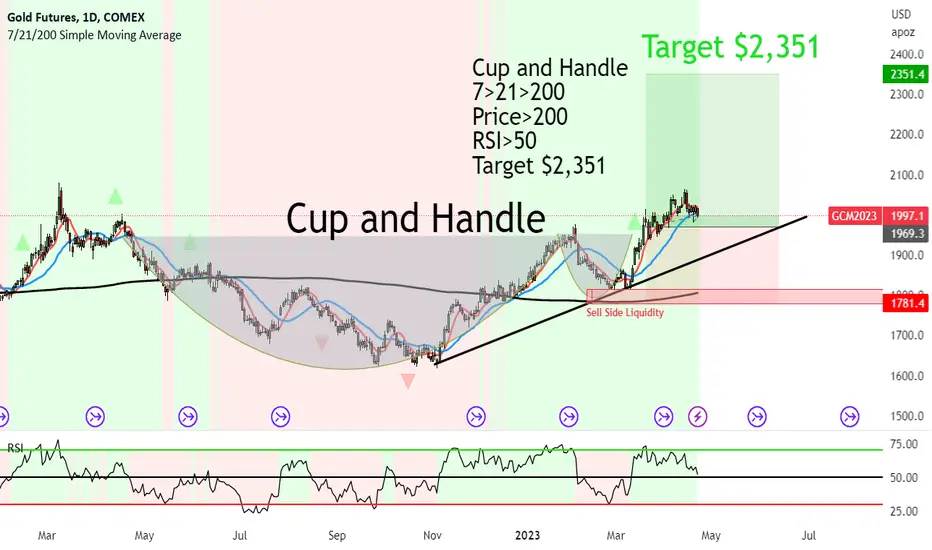
Gold still setting itself for upside to $2,351 with SMC ExplainCup and Handle formed on Gold recently.
We had a break above the brim level.
Now we are having some kind of retracement, for Smart Money to pick up orders before heading on up.
7>21>200
Price>200
RSI>50
Target HKEX:2 ,351
SMC:
Sell Side Liquidity order block is just below the handle of the C&H.
This is also where the powerful 200MA is.
When the price came down, Smart Money swept the liquidity of selling (bought into them) and hence the price shot up.
I am still very much bullish with Gold - Until further notice.
Gold 15 min TF forming a bull flagAfter a long upside run, gold is making a clean trend down with almost 4 touch points so far. A trend breaking to the upside could give a good RRR.

GC1!4.20.23 This is a follow-up gold chart from earlier today. I decided to post this because this is an example of how a higher time frame such as a 4-Hour chart can give you more immediate and more relevant information than a smaller time frame... which makes it much easier to trade.... and you don't really miss anything even though we used two bars on a 4-Hour chart. You could have been a seller or a buyer here today and made about HKEX:4 ,000 in either direction as long as you pick the right trade location... and you can use Gaps to do that.

Gold Daily Log Chartdistance from 50 day moving average
#Gold's distance from 50 day moving average review.
Keep in mind, corrections are a mixture of time and price.

Gold's Weekly Log ChartSo yeah, #gold is close to taking off...
Are you worried?
I'm not.
notes:
bullish consolidation above early breakout line
non reporting small speculator longs breaking out
net about to over take total shorts

Gold may not shine for 2 yearsGold is undergoing Elliot wave's 4 th wave consolidation
This will take equal time of 13 years of Mega 3rd wave rally.
GOLD may not shine during Stagflation Economy Cycle.
Smart investment in gold may be after it reaches $1045 again

Gold Ending diagonal?lower timeframe view. do we head a little more down until we continue the move up?

GC! | Informative| Gold 2023-24 Perspective | BullishCOMEX:GC1!
Possible Scenario: Long
Evidence: Macro Economy variables, including $DXY bearish price action, inflation, and recession outlook for following years, I expect at least a 50% price jump.

Gold4.18.23 Gold: In this video I was trying to review the price action of gold and how you can have a fairly predictive way of knowing where the market might go and what that means to buyers and sellers. this is not necessarily Your signal that you must trade your strategy or be a stop and reverse trader....It's a way of knowing when the market is likely to change direction at least for a while. It's something you might do to be more objective about the price action so that you can have A sense of when the Market's going to work for you or against you if you have a trade Position. This shows you potential reversals, But I would not Necessarily make a trade decision on every reversal. However, Since you're going to be trading for the next 10 to 30 years..... it may be worth your time to go through the exercise of looking at this because it may be much more objective than arbitrary internal monologues...ie. your internal thoughts over greed and fear as opposed to with the chart is telling you.

Gold is expensive. Don't waste it!Investing physically in most commodities is almost impossible due to operational constraints: they tend to be voluminous, expensive to store, move and insure, and can be very perishable. Most commodities investments are, therefore, made through futures contracts and therefore suffer, most of the time, from negative roll yield. However, this is not true for precious metals. Gold and silver are durable, they carry a high price tag per weight and, therefore, can be stored very cheaply in bank vaults. Overall, physical investments in gold or silver are easy and cost-efficient.
When investing in gold or silver, investors have the choice between:
Physical holdings using, for example, physically-backed exchange-traded products (ETPs)
Futures contracts (which can also be replicated in a synthetic ETP)
But which one is the most efficient?
When investing physically in gold, the cost of investing is known in advance. For physically-backed gold ETPs, the total expense ratio can be as low as 12 bps per year. On the contrary, when investing in futures contracts, the cost of investing is not known in advance as it is subject to a roll yield linked to the shape of the futures curve, which can change at any time. So, investors need to ask themselves ‘how often is the cost of investing in futures contracts above 12bps and how often is it below 12bps?’
The result is very clear. Over the last 15 years, a futures-based investment in gold has underperformed on average by 0.94%1 per year compared to physical investment. A lot more than 12bps!
More importantly, looking at one-year holding periods, physical gold has outperformed futures-based gold 99.1%1 of the time. Even considering the 12bps of costs of a gold ETP, physical gold outperformed 97.8%1 of the time. Even on short investment periods, physical gold outperformed most of the time (89.8%1 of 3-month investment periods).
Why is physical gold a more efficient investment?
The shape of the futures curve drives the cost of investing in futures-based gold. In contango, investors bleed money through the roll yield. For gold futures investment to outperform physical gold in the medium term, the roll yield needs to be under 12bps per annum. The curve needs to be in a very slight contango or in backwardation. In backwardation, the investor benefits from the roll yield (instead of paying it).
Unfortunately for investors in futures contracts, the gold futures curve is driven by very stable factors that lock it in contango most of the time. Looking at the long history, the average roll yield between the first and third futures for gold is -1.5% (that is, the third contract was 1.5% more expensive than the first one). The curve was in backwardation only 79 days over the 12,107 business days between January 1975 and February 2023, that is, only 0.66% of the time.
When investing in gold futures, whether it’s a stand-alone gold investment or as part of a broad commodity investment (like in the Bloomberg commodity index), investors are hoping that the gold curve will remain in backwardation for a large portion of their investment period. But, in more than 50 years of history, this has never happened for periods longer than 15 days.
What about silver, then?
Silver futures' behaviour is very similar to gold futures. The average roll yield between the first and third futures for silver is -2%. The curve was in backwardation only 81 days between January 1975 and February 2023. Over the last 15 years, a futures-based investment in silver has underperformed on average by 1.29%1 per year compared to a physical investment.
WisdomTree is the leader in Europe for commodity exposure in exchange-traded products. As such, we aim to offer our investors the most innovative strategies to invest in commodities.

GOLD FUTURES Stock Chart Fibonacci Analysis 041723 Trading Idea
1) Find a FIBO slingshot
2) Check FIBO 61.80% level
3) Entry Point > 1994/61.80%

GOLD COFFEE4.17.23 Follow up on gold and coffee using our indicators and spending some time on gap relationships So that we can find Reversal patterns And calculate Probabilities with more accuracy. As long as you have decent volatility you can make money as a buyer and a seller.

How Much Gold Does Your Portfolio Need?Economists make forecasts to make weathermen look good. Trying to forecast trends in complex systems is never easy. As with weather, financial markets are influenced by a myriad of factors which can make prediction akin to gambling. Time in the market beats timing the market so a far safer bet is building a diversified and informed portfolio.
As mentioned in our previous paper , gold is a crucial addition to any well-diversified portfolio. Gold offers investors the benefits of resilience during crises, diversification, and low volatility while also being a good hedge against inflation.
With crisis ever-present, from pandemics and geo-political conflict to financial instability and recession, uncertainty is on everyone’s lips, including central banks which bought a record 1,135 tonnes of gold last year. Central Banks have shown no signs of slowdown going into 2023, buying 74t in Jan and 52t in Feb, the strongest start to central bank buying since 2010. It is clear why, with rising global inflation due to 2 years of unprecedented QE. A decade of cheap money has its costs which are coming back to bite both consumers and central banks.
This is now being played with collapsing banks and crumbling businesses. Though governments may term these exceptions, they’re the inevitable consequence of hiking rates too fast. And even though inflation has now started to cool, it is proving stubborn and the risk of recession looms. In crisis, institutions and individuals rush to gold.
It’s no wonder then that gold prices spiked in March nearing an All-Time-High above USD 2,000/oz. Gold continues to trade above the key 2000 level even in April. Even now crises show no sign of slowing. Recession talks have become commonplace and phantoms of 2008 haunt with bank collapses. The world is increasingly moving towards reshoring and friendshoring, and de-dollarization is talked about more and more. It is almost inevitable that gold will break its all-time-high soon.
But, buying gold is the easy part, in fact, our previous paper covered 6 Ways to Invest in Gold. Managing gold as part of a larger portfolio is more nuanced. Allocating the right amount, finding the right entry, and knowing when to cash out are all critical.
This paper aims to address two questions –
1. What are the key drivers of gold prices in this decade
2. How should investors use gold in balancing portfolios to navigate turbulent times?
What Propels Gold After Its All Time High?
SVB and Credit Suisse pushed it to its brink. In fact, spot prices in India, Australia, and the UK sailed even above their All-Time-High. But what propels gold now?
Financial Instability
Was Credit Suisse the End?
“The current crisis is not yet over, and even when it is behind us, there will be repercussions from it for years to come.” - Jamie Dimon
Unfortunately, Credit Suisse was likely just a symptom of the larger problem. 2-years of near-free money has inevitably led others to make risky bets which catch up to them during periods of QT.
Additionally, Credit Suisse and SVB’s collapse were both set off by an unprecedentedly aggressive rate hiking cycle. Fed is stuck between a rock and a hard place as they try to control runaway inflation with aggressive rate hikes. Higher rates for longer increase the risks of financial instability.
Stubborn Inflation and Recession Risks
Stubborn inflation? Wasn’t inflation on its way down after almost a year?
Yes and No. Although yearly inflation has definitely cooled in most countries from their peak last year, inflation continues to tick up month-by-month above the targets that central banks have set for themselves. It is not expected to reach below their targets even before 2025 in many countries.
This is because although energy and commodity prices have cooled with demand waning, core inflation continues to remain stubbornly high. Additionally, food and energy prices are still volatile.
On the back of this, recession risks remain high. Recently released FOMC meeting minutes showed that officials expect a recession in the second half of the year. A recession in many countries now seems inevitable. Gold shines during recession and high-inflation environments.
High Interest Rates
Wasn’t the Fed done hiking?
Currently, CME’s FedWatch tool shows a ~72% chance of another 25bps hike next month despite the surprisingly low US CPI print.
Does another 25bps matter?
What’s more important is that 25bps is the peak rate and most central banks are calling this summit a pause and not a pivot. As such, rates will likely remain high for the remainder of 2023. Gold tends to perform well during high interest rate and risk-off environments.
Escalating Tensions, Friendshoring, and De-Dollarization
Last but definitely not least are central banks and their gold-buying binge. Though some of this can be explained by the ultra-high inflation. It is undeniably also driven by rising political tensions. The conflict in Ukraine continues to rage and the US extend its trade war against China with the CHIPS act. This is driving many of the largest economies to reshore and friendshore key supply chains.
This also means relying less on the USD which can be weaponized by the US. De-dollarization has been underway for the last 23 years as the share of USD holdings in foreign exchange reserves has declined from 71.5% to 58.3% over the past 23 years. Current conditions make it more likely that the trend will accelerate. Gold inevitably benefits from all of this as it is one of the only assets that no other central bank can print or freeze.
All of these factors will likely drive gold in the coming decade. But instead of setting a price target, investors can be prudent and methodical by properly allocating it as part of a larger portfolio.
Using Gold in a Portfolio
From 2000 until now, the following portfolios would deliver:
Since 2000, gold has been the best performing asset out of the 3 main components of a basic portfolio – Large Cap stocks (SPY), Treasury Bonds (10Y), and Gold. Gold price has risen 609% compared to SPY at +193%. Investing in 10-year maturity treasury bonds would have netted investors 110% during these 23 years.
As such, larger portfolio allocation towards gold would have yielded investors far more during this period. However, this comes at the downside of higher volatility. Gold has had an average 12-month rolling volatility of 15.8% over the last 23 years, slightly higher than SPY’s 14%.
Still, not all volatility is bad, especially if the returns outweigh the risk. Volatility to the upside can be beneficial to investors. In order to measure the returns from the portfolio after accounting for higher volatility-associated risk, investors can measure the risk-adjusted returns using the Sharpe Ratio and Sortino Ratio.
Sharpe Ratio measures the amount of excess return generated by taking on additional volatility-related risk. The higher the Sharpe Ratio, the better the portfolio is performing relative to its risk. The figure below contains the Sharpe Ratio for each of the portfolios across the last 23 years.
Since each year had a different risk-free rate due to changing monetary policy, the Sharpe ratios vary for every year and there are periods during which gold-heavy portfolios have highest Sharpe ratios and others where it has the lowest. This highlights gold's sensitivity to changes in monetary policy.
Sortino Ratio also measures risk-adjusted returns like the Sharpe Ratio however it only considers the risk of downside volatility. In other words, it measures return for every unit of downside risk. The figure below contains the Sortino Ratio for each of the portfolios.
A key difference between the Sharpe and Sortino Ratios can be seen in the readings for 2009. Sharpe Ratio for a gold-heavy portfolio is the lowest in 2009 due to high volatility in gold prices. However, since this was volatility to the upside, the Sortino Ratio for a gold-heavy portfolio in 2009 is the highest.
In 2023, a Gold heavy portfolio has performed the best and has the highest Sharpe and Sortino Ratio due to gold's relative overperformance amid the banking crisis.
DISCLAIMER
This case study is for educational purposes only and does not constitute investment recommendations or advice. Nor are they used to promote any specific products, or services.
Trading or investment ideas cited here are for illustration only, as an integral part of a case study to demonstrate the fundamental concepts in risk management or trading under the market scenarios being discussed. Please read the FULL DISCLAIMER the link to which is provided in our profile description.

GOLDi believe gold should be start correction range and then continue up trend and break supply
at the short time---------- have down trend
at the long time----------- have up trend
