DOT/USDT - Bearish continuation before bull runWaiting for symmetrical triangle (bearish) breakdown to buy DOT at 5$ with long term targets : 20$ - 25$ - 50$
DOTUSDT trade ideas

POLKADOT AMONG MY PICKS FOR ALT SEASON
This could be Polkadot for the bull run. Price might retrace to $5.6 but i highly doubt it with the presence of strong volume an relative strength index already above the previous high syncing with the price action, it is a strong indication of buyers taking charge and imminent price surge.
Again as I have emphasised on previous analysis, do not time a perfect entry just accumulate for the ALT SEASON and expext at least x3-5.
OTHER ANALYSIS

DOT READY TO BOOM AFTER A PULLBACK!!
#Polkadot it failing to flip the local resistance into support. We have a monthly POC and the 0.618 fib level below to hold as support. If we can get a bounce there, I would expect PA to push higher to try and flip the blue box into support next!
Calculate Your Risk/Reward so you don't lose more than 1% of your account per trade.
Every day the charts provide new information. You have to adjust or get REKT.
Love it or hate it, hit that thumbs up and share your thoughts below!
This is not financial advice. This is for educational purposes only.

DOT We see a classic ascending triangle pattern in the chart. In my opinion, this is one of the best positions in the market. Good luck

Polkadot (DOT): Fakeout Near Resistance / Shorting?Polkadot caught our attention with its price, showing some signs of a fakeout near the resistance zone (which was broken but not secured).
As we are forming a fakeout here, we are also looking for potnetial downward movement here, so eyes open!
Swallow Team

Polkadot - higher time frame setupWe are looking for a higher time frame play on DOT. We believe the recent setback provides a good opportunity to place our first entry. If the price drops further, potentially due to news or other factors, we plan to place a DCA (Dollar-Cost Averaging) bid below the current daily demand zone.
The daily demand zone should hold; otherwise, the bullish count would be invalidated, and we could see lower prices. The target is not specified yet as we are waiting for the market to show us potential levels.
From the chart, we can see the following key points:
- The daily demand zone around $7.17-6.88 is crucial for maintaining the bullish structure.
- The next significant resistance lies in the daily supply zone between $8.58 and $9.11.
Let's see how this plays out as the market evolves. ✅

Buy today, and we'll see you in December 2024.I feel that today is still a good buying opportunity. There were people who bought at $10 thinking it was cheap, although today it is 50% cheaper...
Now, logically, you should have been buying. An excellent entry point was buying DOT at less than $5, ideally in the $4 range. However, if you haven't bought yet, don't regret buying DOT at $1 more. It's worse to buy when it's already at $7 in this Christmas rally.

DOTUSDT IDEAHello Trading view Family / Fellow Traders.
I hope you have used and benifited from the previous analysis .
In today trading session we are monitoring DOTUSDT for a buying opportunity,
DOTUSDT UPDATE
Breakout of the Falling Wedge Pattern has almost complete ,In 8H Timeframe✴️
So,I Expect a Bullish move of +35%💸

DOT ANALYSIS (6H)From where I inserted "Start" on the chart, it seems that the price entered a correction.
This correction is a triangle or a more complex pattern (diametric or symmetrical).
From the green area, it can move towards the targets.
Closing a daily candle below the invalidation level will invalidate the analysis
For risk management, please don't forget stop loss and capital management
When we reach the first target, save some profit and then change the stop to entry
Comment if you have any questions
Thank You

DOTUSDT - who is bullish on crypto?Disclaimer: I don't have a fundamental basis to actually believe in this scenario, but what I see on the chart I see on the chart.
With that out of the way, the shown scenario of an impulse followed by a rather big flat correction, which might be done now, would be extremely bullish, since it would suggest new all time highs (that would be a 13x from here at minimum).
Never only consider one way though, even without changing too much of the count, a not so nice mid/long-term alternative would be this:

#DOTUSDT | 4 HOUR TIMEFRAME UPDATE#DOTUSDT | 4 HOUR TIMEFRAME UPDATE
We can expect that #DOTUSDT will come to the zone of $6.670 - $6.500 (the grey area that you see on the chart). At that grey area, we can look for confirmation ✅ to open a LONG position.
The target of this UPWARD movement is to reach $7.010 - $7.190 - $7.570 - $8.060
Invalidation below $6.015 ❌

Alikze »» DOT | 61.8 Fibo retest scenarioAccording to the long-term analysis, the DOT currency is moving in the 1W time frame, which, as mentioned in the updated micro-waves of the previous post, completed a complete cycle in accordance with the path in the range of 11.92.
💎 First scenario: due to the recent three-wave correction and support in an important PRZ area, an upward corrective movement is currently underway, which is currently stopped at the 0.618 area. Therefore, if this X wave is not upward and after the completion of the correction log until the liquidity zone or PRZ leads to the failure of the zone and the daily candle is closed above it, it can continue the movement until the specified resistance PRZ zone. to give
💎 Second scenario: If the support PRZ area is broken, this can lead to a continuing corrective lag and a combined correction and correct the whole wave up to 0.23.
If the behavior and structure of the post changes, it will be updated.
»»»«««»»»«««»»»«««
Please support this idea with a LIKE and COMMENT if you find it useful and Click "Follow" on our profile if you'd like these trade ideas delivered straight to your email in the future.
Thanks for your continued support.
Sincerely.❤️
»»»«««»»»«««»»»«««

DOTUSDT - Looks Bearish on Hour timeframeKey levels are defined on the chart.
I am expecting another LL because it has already created one LH.
Their is no sign for trend reversal on short term. Expect for Short entry if it break SL.

DOT - Daily Shortterm Trend & Support/Resistence Trade Signal - DOT - Daily Shortterm Trend & Support/Resistence Trade Signal - 23 May
DOT now completed a correction and are ready to return to gain higher.
The new opportunity at the current price
🟢 Trend: Bullish 🚀
🟢 Support: $ 5.5
🟢 Target: $ 50
------
Current: $ 7.5

DOT has been consolidating for last 4 weeks!As you can see DOT is in a consolidating phase at the bottom of the trend line, in the next months price can pump to the top range, whitch is 16-20$!

Bullish pennant on DOTWe can clearly see that DOT is forming a bullish pennant, breakout will be happening in a few hours, and price can jump to 8$.
8$ is a very strong resistance, if that resistance will be broke, the next target will be 14$.


DOT Fake OutWho is at the helm of the U.S. economy....right now....? Enough Said. What just happened was a fake out. To many countries are about to start dumping US bonds....no real rally for a while I'm afraid.

DOT a False Breakout?The symetrical triangle that formed at the end of the recent downtrend was optimistically viewed by many as a potential trend reversal. Then the news of a possilbe approval for an ETH ETF after tweets by the SEC caused a breakout.
A re-test of teh symetrical triangle around $7.20 is a possible scenario, however, if after the retest price does not hold above $6.90, then the recent spike in price will prove to be a false breakout.

DOTUSDT-Bullish FlagThe cryto pair made bullish flag pattern on 1h TF. Entry can be taken at current price with SL and TP mentioned.

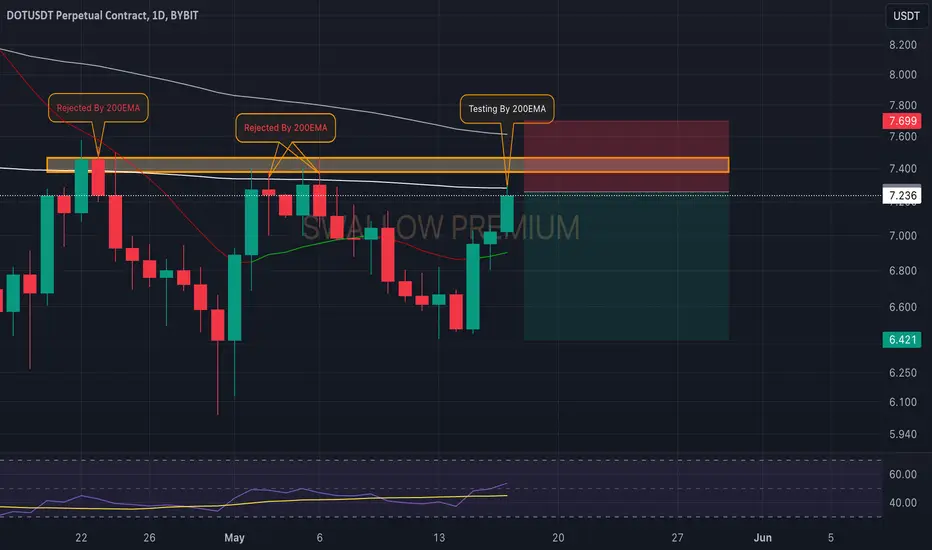
Polkadot (DOT): Keep an Eye on 200EMA !!!We are back with Polkadot, where our attention has caught that 200EMA which has been holding its ground since April 22.
We are now yet again back at 200EMA testing it, and we are looking for a potential rejection to happen from here. If we see it, we should see a nice downward movement from here!
Swallow Team
Trade Plan for Polkadot: Ready for Another 100% Gain?Fundamentally, GATEIO:DOTUSDT appears like a dead project, which is obvious in its price action in the last 8 to 12 months.
Dot does not look good for investors but is not bad for trading.
Again, we are ready to trade its breakout for a possible 100% profit, when the opportunity presents itself.
What do you think about Dot? Share it with me in the comment box.
If this analysis makes sense to you, follow me now for more and support my idea.
Cheers!

DOTUSD 1WDOT ~ 1W
#DOT We hope that this Support Block will be retested again. And we wouldn't hesitate to place a sizable purchase here. with a long-term target of at least 25%+
