Ethereum Parallel ChannelsEthereum parallel channel, the upper line is the top and the lower line is the bottom.
ETHDOWNUSDT trade ideas

ETH Market Update and Key Support LevelsCurrent Situation:
Recent Price Action: ETH saw a massive wick yesterday, flushing out most longs that jumped in after the 20th of May.
ETF News: The ETF news is bullish for crypto as a whole, but historically, such news has led to a temporary price drop.
Historical Context:
Past ETF Approval: Previous ETF approvals have resulted in a 20% dump on BTC and ETH, lasting around 10 to 12 days before prices began to gain traction again.
Key Support Levels to Watch:
$3,500: Major support level where buyers are likely to step in.
$3,300: Another critical support level that could mark the bottom.
$3,200: Strong support level, potentially marking the end of the correction.
Strategy:
Monitor Support Levels: Keep an eye on these support levels ($3,500, $3,300, and $3,200) as they may provide good entry points for long trades.
Be Patient: Given the historical pattern, there might be a temporary dip before the market gains traction again.
Risk Management: Set tight stop losses just below these support levels to manage downside risk effectively.
Summary:
ETH is experiencing a temporary pullback likely influenced by the recent ETF news. Key support levels at $3,500, $3,300, and $3,200 should be monitored closely as potential entry points for long trades. Historical patterns suggest a possible 10 to 12-day dip before the market resumes its upward trajectory.

short eth a quick scalp.
using leverage. Using the supply level, building a short trade.
relying on the fibs for a move to the 38.
not suprised if there is a push up

This is ready to explode
How high can this go?
(IMO, Target = $ 10k)
Wave degree:
Primary: Wave 5 (larger degree),
Intermediate: Wave 3,
minor: Wave 3 (Impulsive rally),

ETH - Liq Hunt before ETF?ETH just had over an 8% liquidation hunt to the downside.
The chart on the left shows the zoomed out daily (with our two important trendlines) and the chart on the right is a zoomed in 2H chart showcasing the firesale wick we just printed.
This happened exactly as the clock struck 3:00 CT, so maybe it was news related, but I have not found anything yet.
What I do find interesting is the wick went EXCATLY to our trendline to retest it as old resistance flipped into new support. This has been a trendline we have been watching and was outlined previously in this post.
So far the selloff was eaten up very quickly and we are almost back to the same level where the dump started.
Therefore, was this just a liquidation hunt to wipe out overleveraged longs before some sort of approval?

ETFWhen the Bitcoin ETF was confirmed, Bitcoin corrected 20% and then rose 90%
So we can expect Ethereum to correct up to 3190 and then go to 6110
Hoping for the best market

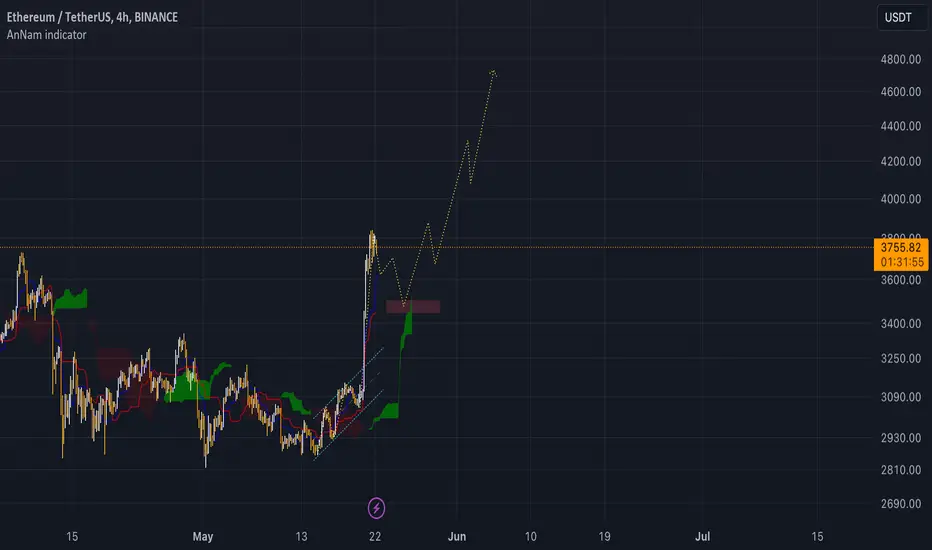
ETH - It is Happening! 🦋Hello TradingView Family / Fellow Traders,
As per my last analysis, shown in the attached chart, ETH rejected the $3000 round number and surged by over 20%.
What's next?
📈As long as the $3500 round number holds, we expect a continuation towards the previous all-time high of around $4800.
📚 Always follow your trading plan regarding entry, risk management, and trade management.
Good luck!
And always remember:
All Strategies Are Good; If Managed Properly!
~Rich

#ETH Leaving this chart here for tracking, lets see where we go in next few months, need the breakout similar to how we had on smaller one :P

ETH trade idea updateEth has taken marked trendline liquidity and also sell side liquidity, So now lets pump it towards 4k$+.

Long ETH Watch the chart and waiting up to 3815-20
If breaked you can long and if can't break it can be short p

$$$ ETHUSDT, GOING TO BREAK BULLISH PATTERN$$$Welcome, Trader. Welcome to our crypto community! 🚀We are delighted to welcome you, whether you are an experienced trader or new to cryptocurrency.
We are willing to discuss #ETHUSDT💹.
#ETHUSDT 🔥🚀.
___________
Update:
Time Frame: 8 Hr
➡️ETHUSDT formed a falling wedge pattern, A possible bullish symbol.
➡️Waiting for a breakout to this pattern🚀.
➡️ Take a bullish turn from the major support area.
➡️ Waiting for retest confirmation.
➡️ We anticipate around 28% in the medium term. 👉✅.

Eth ready for $6k/ should we long now?Will be looking to long Eth from
3525$
3380$
These levels have my interest to go long on Eth and Sl will at $3k or below it at 2950$
●Long targets will be previous bull run ATH and $6k.
●Once Eth reaches these levels I'll be looking for confirmation in LTF.

ETF approval will pump ETH price to a new ATHHi everyone,
After consolidation within 3000 - 2800 support area Ethereum price skyrocked on the news about possible ETH ETF approval. Few days ago ETH ETF has been approved and Ethereum price continue to rise even though Bitcoin price is slowly declining.
If Bitcoin price won't dump in the coming days then I expect Ethereum rise at least up to local high at 4080 price level but even if there will be some correction on Bitcoin I don't think that ETH price will significantly dump.
There is one thing to note about ETH ETF. Even though it was approved, the real trading will start at least one month later, so there is room for Ethereum price to go up or down before ETF trading starts. But overall ETF approval is a higly bullish news for Ethereum and most likely it will pump its price to new all time highs.
Please, do not forget to boost this idea & share it with your friends; thanks.

eth → a little bit downward and the an upward movementhello guys...
Ethereum has formed a knife-down pattern so we can anticipate a downward movement toward 2942$ level.
but as I published before the main trend is bullish in the ethusdt coin.
___________________________
✓✓✓ always do your research.
❒❒❒ If you have any questions, you can write them in the comments below, and I will answer them.
❤︎ ❤︎ ❤︎And please don't forget to support this idea with your likes and comment

ETH - Deja Vu🦋Hello TradingView Family / Fellow Traders,
For those who know me, I always enjoy studying previous price action.
📌Today, I want to share an interesting pattern I found on ETH.
Back in Summer 2021, ETH experienced a parabolic bullish impulse (depicted in blue), followed by a correction (shown in purple) to reject the $3000 support before commencing another bullish impulse movement.
If we apply the same logic to the current price action, ETH is currently in the correction phase, rejecting the $3000 support.
Thus, I will be looking for buy setups on lower timeframes, speculating on the next bullish impulse movement.
Of course, this pattern will be invalidated if the $3000 mark is broken downward.
🗒 What do you think? Will history repeat itself?
📚 Always follow your trading plan regarding entry, risk management, and trade management.
Good luck!
And always remember:
All Strategies Are Good; If Managed Properly!
~Rich

ETH not looking good!Here is the possible scenario in my opinion for the ETH in the future…reject from the resistance get the support in lower zone and then break out of the trend line and move up…
Looking at ETHBTC and BTC Dominance chart and the weakness of Eth against Btc lately, convinces me about this scenario.
Lets see how its gonna play out.
Always a student…

SHORT #ETHUSDT Keep an eye on the activity!SHORT #ETHUSDT from $3 888 stop loss $3 927
15m TF. The asset has reached the second resistance, which is confirmed by volumes. And removed liquidity from the 3909 level. Usually, such events are followed by local termination of the level and correction. The scale of the correction depends on each specific level and timeframe. In the case of the third approach, a breakdown of 3888 is likely in order to remove liquidity from the level of the beginning of the 3818 impulse. We have a bull market and a trend. You can filter the signals, counter trend. Keep an eye on the activity!

ETHUSDT, Important update leaksWelcome, Trader. Welcome to our cryptocurrency community! 🚀We are delighted to welcome you, whether you are an experienced trader or a newcomer to cryptocurrency.
We are ready to discuss #ETHUSDT💹.
#ETHUSDT 🔥🚀.
Update:
Time frame: 8hr
➡️ ETHUSDT created a symmetrical triangle pattern and break it towards upside.
➡️ Breakout confirmation is done successfully.
➡️ Waiting for a retest confirmation.
➡️ We anticipate approximately 15% for the soon. 👉✅.

ETH BULL TRAPIm concern about about may be we are in Bull trap because this is how Head and shoulder build.may be we are going to make a head now. in BTC we made a reverse head and shoulder on weekly , we have left shouder and and head and also btc is about to make a shoulder which is downside .
im feeling its a bull trap ( knows and head and shoulders head )

🔥 Ethereum Bull-Flag Break Out!After months of bearish price action, Ethereum has finally broken out of a bull-flag pattern. The fact that we're up >10% on the break out is extremely bullish.
I think this is the start of a prolonged bullish trend over the summer. First target placed at $5000.

Second big shot of ETHETH can have second big shot if it complete triangle pattern with breaking up.

Check for support in the 2nd sectionHello traders!
If you "Follow" us, you can always get new information quickly.
Please also click “Boost”.
Have a good day.
-------------------------------------
(ETHUSDT 1M chart)
The key is whether it can receive support near the Fibonacci ratio point of 0.618 (3548.07) and rise above the upper point of the HA-High indicator box on the 1M chart.
If the price is maintained above the HA-High indicator, I think there is a high possibility of a full-fledged upward trend.
Therefore, it is expected that a full-fledged upward trend will begin only when the price is maintained above the 3321.30 point, which is the HA-High indicator point on the 1M chart.
If not, and it falls, you should check for support around 0.382 (2647.80).
(1W chart)
It has touched the psychological volume profile zone and is rising.
The key is whether it can receive support in the 3503.68-3730.71 range and rise above 4093.92.
If not, and it falls, you should check for support around 3025.27-3321.30.
If the price maintains above 4093.92, it is expected to rise to around 4868.0.
(1D chart)
It should rise to the HA-High indicator box section (3570.0-4010.98) on the 1D chart.
Accordingly, the key is whether it can receive support around 3570.0 and rise above 3903.61-4010.98.
If the price is maintained above 3903.61-4010.98, a full-fledged upward trend is expected to begin.
The 3025.27-3321.30 section is the HA-High indicator section of the 1M and 1W charts, so it is an important section.
Since the price broke above this important zone with a sharp increase, if the price holds above 3025.27-3321.30, it is expected to renew the latest previous high.
---------------------------------------------
(1D chart)
Please refer to the HA-Low and HA-High indicators used to initiate trading and the BW indicator to verify them.
We need to check if we can receive support around the current secondary range, that is, the 3570.0-3730.71 range.
If you were unable to buy around 2817.0-3025.27, I think it would be a good idea to check for support in the 3903.61-4093.92 range and proceed with buying.
The reason is that the HA-High indicator was created and a high point was formed.
Therefore, the HA-High indicator point at 3903.61 can become a resistance point.
From a day trading perspective, if support is confirmed around 3570.0, you can buy and sell around 3903.61.
Have a good time.
thank you
--------------------------------------------------
- The big picture
The full-fledged upward trend is expected to begin when the price rises above 29K.
This is the section expected to be touched in the next bull market, 81K-95K.
#BTCUSD 12M
1st: 44234.54
2nd: 61383.23
3rd: 89126.41
101875.70-106275.10 (when overshooting)
4th: 13401.28
151166.97-157451.83 (when overshooting)
5th: 178910.15
These are points that are likely to encounter resistance in the future.
We need to see if we can break through these points upward.
Since it is thought that a new trend can be created in the overshooting zone, you should check the movement when this zone is touched.
#BTCUSD 1M
If the general upward trend continues until 2025, it is expected to rise to around 57014.33 and then create a pull back pattern.
1st: 43833.05
2nd: 32992.55
-----------------

ETHUSDT waiting for correction to buy then sell at 4400-4700Buy ETH around 3300-3600.
Stoploss 3000
Sell 4400-4700
This moment is a bit sensitive so waiting is patient and take the profit.