Ethusd potential play Looking at a nice inner range short that you can take to capture the sell side liquidity or potential swing further down as the previous idea that I have posted
PAYtience pays
Set that alert
Be aware of post market spread at 4pm cst
ETHUSD trade ideas

Ethereum (ETH): Strategic Entries and Potential DropsFor Ethereum, we're observing a chart pattern that has developed a weak divergence, and we believe it is now correcting wo the end of Wave 4 of Wave (3). We plan to place multiple entries; our first entry was at the upper range of the Wave 4 target area around $3200. However, the price has continued to decline. We are now looking to DCA and make a second entry at $2600, with a final entry in our worst-case scenario at $2277. We suspect there might be further downside potential, but the extent is uncertain, and we intend to buy additional spots. Those already in from the first entry can choose to hold or buy more—this is on yourself. Given the expected market weakness, there could be opportunities to establish substantial long-term spot positions.
Upon examining the annual VWAP, we're observing a scenario where the 2021 VAH is acting as a current resistance level. We briefly surpassed this level but quickly fell below it again. We believe there could be good entry opportunities in the area between the 2021 VWAP and the 2022 VAH, which closely align around $2,500 to $2,450. Below this, the next significant level could be the 2023 VAH around $2,000, indicating a substantial gap in the middle. This will be elaborated further in subsequent sections of our analysis.
However, this setup on the larger chart presents a probable scenario, yet we're also considering managing our positions above this range as shown above. The 61,8% Fibonacci retracement is still the second entry target for us.
12H
On the quarterly VWAP, we observe that the VWAP from Q4 2021 acted as resistance at exactly $4,100. Since then, we've experienced a downward trend and identified several levels acting as resistance or support. Currently, we're situated right at the 2022 Q1VWAP and the 2021 Q3VWAP, which could provide enough support to push us above the $3,000 mark. Ideally, surpassing the $3,200 mark would be beneficial, but we perceive this as challenging since the current quarter's VWAP is likely to act as resistance around $3,200. We think it's possible we might revisit the levels of the 2021 Q2VWAP to the 2024 Q1VAL, ranging between $2,670 and $2,426. While we don't anticipate falling much below these levels, it's not outside the realm of possibility. These remain our critical levels for now.
4H
Considering the monthly VWAP, there's a scenario where we might see an upward push toward the Previous Monthly VAL, given that the February VWAP has acted as support three times already. This aligns with the desire to see Ethereum exceed $3,200, which would surpass both the February VWAP high and the Previous Monthly VWAP. Achieving and maintaining a position above this level is crucial for a sustained upward move.
If we fail to reclaim and hold this level, it's plausible that Ethereum could revisit lower levels, potentially down to the February VAL around $2,500. Holding above the February VWAP is vital; otherwise, we might see a retracement to these lower support levels.

Ethereum 1d by RB🧐
Hello, dear friends! Today, let's take a look at the Ethereum/Dollar chart!💥
On February 25th, the last line of the descending trend was broken upwards, as indicated by the blue circle - that's serves as an excellent signal for further growth.
The question now is when to expect a correction? And how deep will it be?🧐
The next strong resistance levels are 3590 - 3980! Reaching these levels, the price may start a correction for further growth. The depth of the correction will depend on further price formations, so I will update the chart accordingly!
Thanks for Your attention.
Stay tuned!🫶
Sincerely Yours, Kateryna💙💛

Ethereum Price Yet to React to ETF ApprovalEthereum ETFs were approved partly due to Bitwise's correlation analysis, which has led to analysts expecting spot ETH ETFs to disappoint due to key metrics. The SEC approved 19b-4 spot ETH ETF filings on Thursday due to the high correlation between spot CRYPTOCAP:ETH price and CME Ethereum futures prices, similar to that of Bitcoin. This conclusion was reached through Bitwise's correlation analysis filed with its spot ETH ETF.
Bitwise is publishing a new correlation analysis as part of its new spot Ethereum ETF filing, which is the first ETH correlation analysis to replicate the specific methodology used by the SEC in their evaluation of bitcoin. The SEC's pace and breadth of first comments on S-1 filings are key to watch as they are the next key steps before a spot ETH ETF launch.
Scott Johnsson, a general partner at Van Buren Capital, mentioned that the SEC's pace and breadth of first comments on S-1 filings are key to watch as they are the next key steps before a spot ETH ETF launch. Eric Balchunas speculated that the SEC's comments may come in four to six weeks.
Crypto researcher Noelle Acheson suggests that spot ETH ETFs will meet a disappointing reception when they launch, as the CME's low interest in ETH derivatives — ranking fifth — suggests spot ETH ETFs may not be attractive. He also pointed to ETH accounting for only 15% of the total assets under management (AUM) of Hong Kong's spot crypto ETFs.
Technical Outlook
Ethereum ( CRYPTOCAP:ETH ) is currently trading around $3,740 after moving below the $3,730 price level. If a further decline occurs, the next level to watch out for is the $3,605 support. While prices have yet to react to the 19b-4 spot ETH ETF filings approval, the market may be awaiting the final approval of S-1 applications and the official launch before taking action. CRYPTOCAP:ETH has a positive Relative Strength Index (RSI) of 68.32 which is poise for further gains. CRYPTOCAP:ETH 's daily price chart correlates that of CRYPTOCAP:BTC with both assets depicting a bullish flag pattern in the near to long term respectively.

eth to 6900 "giggity" if we break 4250,MAJOR cup n handleIf we break 4250 we form a major cup and handle. If we take the depth of the both and add it to the handle we have 65% chance of pumping to 6900/ 7k
this pattern is only valid if we break 4250 with a confirmation and turn it into support.
The ETH ETF may be approved this week and it would start blast off to 7k. this is compounded with congress doing a 180 and taking on the SEC
The SEC’s decision on VanEck’s spot Ether ETF is due by May 23.
This is compounded with a big short squeeze. Eth has liquidated 110m in shorts in the past 24 hrs and 1billion in open interest has started on options.
Can I get a hell yeah?

$ETHUSDNot financial advice.
BITSTAMP:ETHUSD
working its way up according to the Fibonacci levels.
News aside it the ETF gets approved CRYPTOCAP:ETH won't be the only one to turn bullish but, in my opinion, all the altcoins and projects in the same ecosystem.
Like and subscribe for more ideas.
Thanks.

ETHEREUM - NEW BREAKOUT 🚀Hello Traders !
After a Huge Bullish Move, The ETH Broke a Strong Resistance Level (3729.16 - 3646.38).
This Key Level Becomes a New Support Level !
So, I Predict a Bullish Move📈
---------------
TARGET: 4002.00🎯

FREMA Levels for StrategyFREMA facts:
Upper hot color bands are based on Buying Pressure
Lower cold color bands are based on Selling Pressure
This makes the levels of bands be more relevant to the candle metrics. The regular ATR bands the upper and lower levels expand equally with ATR change. Whereas FREMA levels expand and shrink by the change of 2 factors: Buying and Selling Pressure.
In a nutshell, it's the bullish and bearish parts of the candle measured with separate variables that govern the upper and lower bands independently. Therefore we can agree that out of all volatility bands, the FREMA is more native to the nature of ongoing price fluctuations.
The volatility levels can be implemented in strategy for trading the range of probabilistic prices. Combination with trend-following indicators can determine the condition of multiple buying orders at different cold color levels.
To be able to catch the very bottoms, the condition of bullish entry series should be set with 0 open trades unless the price or any other price-following substituting components are equal or lower than one of the lowest bands . This filters the entries from risks of buying as soon as price falls below middle deviation line.
For filtering with "Buying and Selling Pressure" use open source code below:

$ETH Price Prediction 5/25/2024Not much movement as price holds above 20EMA.
Weekly close was off a day so the marker has been adjusted.
The goal remains at pattern resistance (3685).
www.tradingview.com

ETH Breakout LongLonged ETH. Was rushing for exam so I didn't manage to post it on time. Clear accumulation in range.
Paper went great btw.

Ethereum will give you a Ferrari in the futureIn the big picture, extremely BULLISH!!!!!!
!In a small picture!:
MACD crossing down is very likely.
Because macd has failed crossing, which makes the next crossing more realistic.
Crossing down means BUY when the price is in red and there is no sign of green. Support points or resistances are required
Under 3000k soon. The landing level is not known today, only time will tell.
I could be wrong, but I could be absolutely right
MoralDisciple

ETHUSD Ethereum has shown strong bullish momentum, with recent price targets indicating potential upward movement. Analysts suggest that Ethereum could test resistance levels around $3,132 and $3,360
There is also a notable support range between $2,680 and $3,100, with potential declines testing the $2,905 level before any further upward movement.
The Relative Strength Index (RSI) for Ethereum indicates it is currently overbought, suggesting a potential for a price correction. Analysts expect the price might dip to around $1,750 before resuming its upward trajectory.
The outlook for ETH/USD remains optimistic with several bullish indicators and key levels to watch. However, potential corrections and regulatory challenges should be considered by traders and investors when making decisions.
Overall Summary: The consensus from various technical indicators is a Strong Buy

$ETH Price Prediction 5/27/2024A bit of correction after price falls short of 4k.
Look to hold support above 3685/50EMA if we drop below 20EMA.
Further recovery is still expected which could begin at the start of next month.
www.tradingview.com

ETHBTC May 28, 2024: A Bullish FlagAfter a 20% run up with the ETF approval on May 20, 2024, CRYPTO:ETHUSD started to form a bullish flag and moved out on May 28.
The flag is above the rising MA-10. The move out provides a buy point here ($3900) with the $4700 target

Ethereum: Long term possible targetsLooks like Ethereum has more chances to test the following targets in 7 years
Target1: 3230
Target2: 3800
Target3: 5120
Target4: 6240
Stop: 1375
Hope this will work, lets see

$ETH soon to come back from breakIt is just the beginning for ETHs run. The anticipation for an Ethereum ETF is starting to buzz around. We have hit the zone highlighted in my previous ETH drawing which consists of a channel and a weekly Ob-. As part of the order block theory composition, I have marked the 'mean threshold' of said Ob- as our next zone of interest. The current price action is drawing a descending wedge at a shallow retracement which says we are strongly bullish.

If Ethereum Can't Break These Levels, Then....Traders,
I have a pretty good record for calling these inverse head and shoulders patterns before they are fully formed. I am not saying for sure Ethereum will form this inverse head and shoulders pattern but if it doesn't, then it will need to break above those resistance levels I have drawn and confirm. If it can't do this on the daily, then I have a hunch this inverse h&s will complete itself.
Ethereum leads the altcoin market rn. So, depending on where your bet lies, you may want to offset some risks and take profit here as we begin to consolidate/accumulate for another bull run.
Stew

May.21-May.27(ETH)Weekly market recapLast week, the SEC unexpectedly approved the ETH ETF. Although it is still some time before the launch of the ETH ETF, the cryptocurrency market has entered a carnival. ETH started pumping, narrowing the gap with BTC in terms of gains. We believe that although the ETH ETF has been approved, the pledge utility of ETH will still make the SEC cautious about ETH.
On the other hand, we saw last week that Donald Trump, the Republican candidate for the 2024 election, stated that he would accept donations from cryptocurrencies, support the development of cryptocurrencies in the United States, and ban CBDCs if the campaign is successful. This is also the reason why meme coins based on Trump have risen recently. If Trump eventually becomes President of the United States, cryptocurrencies will see an even bigger rise.
ETH has performed well last week, with a price increase of nearly 30%, mainly due to the approval of the ETH ETF. Before last week's long green candle appeared, we can see from the MBF indicator that ETH's bottom-buying sentiment was sluggish. But after the ETF was approved, everything changed. On the WTA indicator, blue columns representing whales appear in groups, and trading volume also increases significantly. The wavy area of the ME indicator, which was about to turn into a bearish signal, has once again widened. For ETH, it is currently close to the high point of the year which is also a strong resistance level of 4000.
In summary, we believe that the gradually increasing selling pressure will cause ETH to fluctuate this week. Based on the strengthening bulls, we raise the resistance level to 4000 and maintain the original support level 2800.
Disclaimer: Nothing in the script constitutes investment advice. The script objectively expounded the market situation and should not be construed as an offer to sell or an invitation to buy any cryptocurrencies.
Any decisions made based on the information contained in the script are your sole responsibility. Any investments made or to be made shall be with your independent analyses based on your financial situation and objectives.

💰ETHEREUM MID TERM TARGETS 🔷 Current Status- ETH is currently💰ETHEREUM MID TERM TARGETS 🔷
Current Status- ETH is currently building strong in symmetrical triangle which is a bullish pattern; BTC has given a new high in this bull cycle but ETH is still running behind.
Anticipated ETH to hit a new All Time High in upcoming weeks/months ✅
Once ETH reaches 5,000$ Key Resistance then money flow will move to Alts leading to a Healthy Alt Season which will run fot next months 🔥
We will see small alt season in upcoming months but a healthy alt season is only considered once BTC and ETH Dominance goes down; which will be happening thereafter.
Interpreted month for Healthy Alt Season ➡️September 2024

ETHUSD-RELATIVE STRENGTH LEADERETHUSD Has been a Relative strength Leader today, although currently on Consolidation it broke the Head and Shoulder on 2hr and heading to the 2 days Previous Hight
2Day TMF: Has a 1-2 RTM Setup expecting break and addition above the Previous 2days High

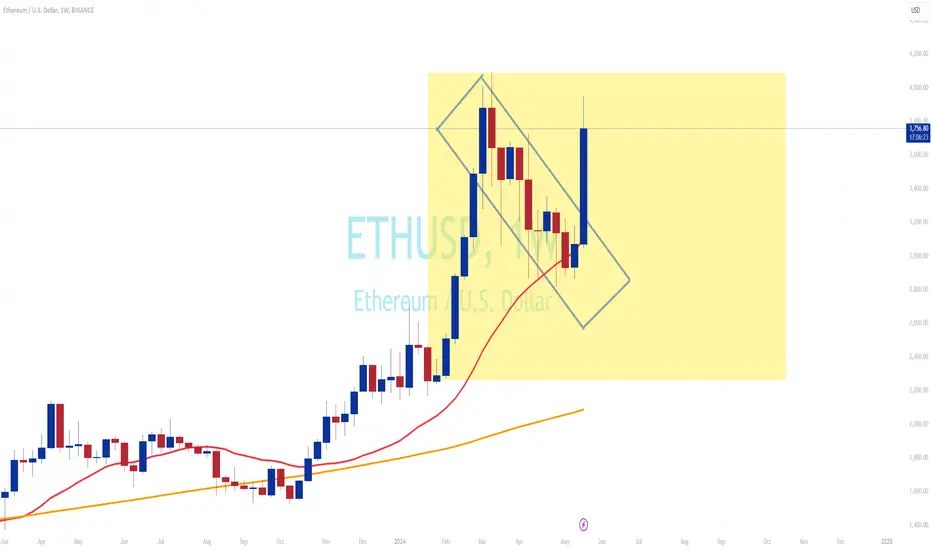
ETH flag breakoutafter retrace for 10 weeks, finally we see a bullish weekly candle on ETH, supported by 20 weeks MAs.
in this zone (in yellow) considered a FLAG formation . is a bullish continuation trend.
will see more upside once market break above $4000 mark.
$ETHUSD ETF ApprovalETH ETF is officially approved. Crowd gave it a 10% approval chance, before the filling updates got public for the VanEck deadline May 23rd. And now the crowd thinks it will have little to no inflow. Bullish.

$ETH Price Prediction 5/26/2024ETH closes weekly well above the goal of 3685 and triggers a breakout off MACD divergence.
A push to 4k+ is expected this week but may hold around 4k until the following.
ATH for this chart is at 4868 with 4635 potentially marking the completion of a W1 bottom.
www.tradingview.com
