ETHUSD BUY ETHUSD - LONG
Trade Reason :
1) 4 hr - Uptrend Market and Channel Bottom
2) 30 Min - Trend Reversed ..
Entry - 3808
Target 1 - 3864
Target 2 - Channel Top 3898
Stoploss - 3760
Happy Trading ...
ETHUSD trade ideas

selling opportunity for Ethereum against the US Dollar (ETHUSD) selling opportunity for Ethereum against the US Dollar (ETHUSD) at the current price of 3559.03. It's recommended to consider initiating a sell position at this level.
Additionally, it's advisable to set take-profit levels at 3510.01 and 3440.05 to secure potential gains in case of price declines.
To manage risk, a stop-loss order is suggested at 3590.05 to limit potential losses in case the market moves against the position.

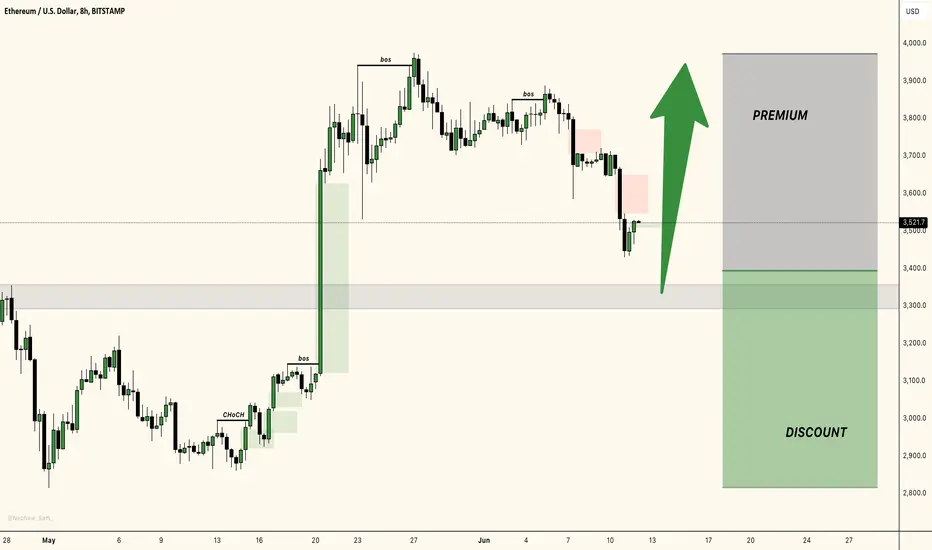
ETH, watch out for this MANIPULATION! We're now in the zone I was expecting!
I'm a buyer on ETH.
I think we are currently on the AMD setup (Accumulation-Manipulation-Distribution).
ETHUSD Pair : ETHUSD ( Ethereum / U.S Dollar )
Description :
Break of Structure
Consolidation Phase in Short Time Frame
RSI - Divergence
Completed " 12345 " Impulsive Waves and " ABC " Corrective Waves
Demand Zone

ETHUSD faces downside riskFrom the daily chart, we can see that ETHUSD encountered resistance and fell back after rebounding in the supply area, and the short-term bearish trend is dominant. At present, we can pay attention to the support near 3380. If it falls below, it is expected to establish a downward trend, and the downward target is expected to look at the 2860-3040 area.

Bitcoin has a strong bearish momentum, could it fall further?Price is rising towards a resistance level which is a pullback resistance and could potentially reverse from this level to our take profit.
Entry: 3,560.84
Why we like it:
There is a pullback resistance level.
Stop loss: 3,722.13
Why we like it:
There is an overlap resistance level which aligns with the 61.8% Fibonacci retracement.
Take profit: 3,350.20
Why we like it:
There is a pullback support level.
Please be advised that the information presented on TradingView is provided to Vantage (‘Vantage Global Limited’, ‘we’) by a third-party provider (‘Everest Fortune Group’). Please be reminded that you are solely responsible for the trading decisions on your account. There is a very high degree of risk involved in trading. Any information and/or content is intended entirely for research, educational and informational purposes only and does not constitute investment or consultation advice or investment strategy. The information is not tailored to the investment needs of any specific person and therefore does not involve a consideration of any of the investment objectives, financial situation or needs of any viewer that may receive it. Kindly also note that past performance is not a reliable indicator of future results. Actual results may differ materially from those anticipated in forward-looking or past performance statements. We assume no liability as to the accuracy or completeness of any of the information and/or content provided herein and the Company cannot be held responsible for any omission, mistake nor for any loss or damage including without limitation to any loss of profit which may arise from reliance on any information supplied by Everest Fortune Group.

Falling towards a pullback support, could it bounce from here?Ethereum (ETH/USD) is falling towards the pivot which acts as a pullback support and could potentially bounce to the overlap resistance.
Pivot: 3,442.46
1st Support: 3,323.12
1st Resistance: 3,657.27
Risk Warning:
Trading Forex and CFDs carries a high level of risk to your capital and you should only trade with money you can afford to lose. Trading Forex and CFDs may not be suitable for all investors, so please ensure that you fully understand the risks involved and seek independent advice if necessary.
Disclaimer:
The above opinions given constitute general market commentary, and do not constitute the opinion or advice of IC Markets or any form of personal or investment advice.
Any opinions, news, research, analyses, prices, other information, or links to third-party sites contained on this website are provided on an "as-is" basis, are intended only to be informative, is not an advice nor a recommendation, nor research, or a record of our trading prices, or an offer of, or solicitation for a transaction in any financial instrument and thus should not be treated as such. The information provided does not involve any specific investment objectives, financial situation and needs of any specific person who may receive it. Please be aware, that past performance is not a reliable indicator of future performance and/or results. Past Performance or Forward-looking scenarios based upon the reasonable beliefs of the third-party provider are not a guarantee of future performance. Actual results may differ materially from those anticipated in forward-looking or past performance statements. IC Markets makes no representation or warranty and assumes no liability as to the accuracy or completeness of the information provided, nor any loss arising from any investment based on a recommendation, forecast or any information supplied by any third-party.

ETHUSD: Bouncing back to ATH | 66.67% Probability!COINBASE:ETHUSD has been getting a lot of attention in the crypto world lately.
It recently went through a big drop in price (-25%) , but now it's showing signs that it might be bouncing back and heading bullish again.
Here's what you need to know:
ETH's price dropped a lot over the past 2-3 months, and it's been consolidating since then. According to my Free Probability Indicator , there's a good chance that ETH's price could hit a new high. Around 66% chance on the 3D chart and 62% on the daily chart which is a pretty high number!
This drop in price could actually be a good thing because it's created a big opportunity to buy ETH at a lower price. Right now, it's about 38% cheaper than its highest price ever.
If you're thinking about trading ETH, here's what you should consider:
Entry:
Wait for clear signs that the price is going up again, like breaking through certain price levels or seeing strong positive movements on the daily chart.
Once you're confident the trend is changing, you could think about buying ETH.
I'm currently looking at 4H Equilibrium to get position
Exit:
To protect yourself from losses, you might want to set a "trailing stop-loss." This means if the price starts dropping again after you buy, your sell order will automatically trigger to limit secure your running profits.
Risk Management:
Make sure you're not risking more money than you can afford to lose.
Only invest what you're comfortable with, and consider how much you're willing to lose if things don't go as planned.
This isn't any financial advice. It's just some insights to help you make informed decisions.
Always do your own research before investing in anything.


ETHUSD afternoon updateMy bullish case for ETHUSD would have a completed impulse off low of 2814.12 for a wave (1), completed zigzag (with leading diagonal A) for a wave (2) with support off of pitchfork and .5 Fibonacci retracement.

ETHEREUM - HEAD AND SHOULDERS Hello Traders !
The Ethereum failed to create a new higher high !
The price formed a head and shoulders pattern.
Let's expect the bearish scenario:
if the market breaks the neckline and closes below that,
We will see a huge bearish move📉
__________
TARGET: 3015.00🎯

ETHUSD ( 4H )ETHUSD
Tendency the price between 3,665 and 3,443
Turning level : The turning level between 3,665 and 3,443
resistance level : breaking turning level 3,665 , the price will rise to3,840 , then will make a new peaks
support level : breaking turning level 3,443 the price will reach the support level of 3,317
and 3,114 , stable this level reach 2,923

ETHEREUM * ETH / USD * DAILY EWP FIB TC AnalysisETHEREUM * ETH / USD * Daily Elliott Wave Principle Fibonacci Trend-Channel analysis

This analysis and advice can help youHello traders!
On the daily chart, ETHUSD fluctuated downward, and the bearish trend was dominant. At present, the downward trend line has effectively suppressed the price. In the short term, attention can be paid to the resistance of 3450-3500 area. If the rebound is blocked, consider continuing to short. The support below is 2863-3045 area.

EthereumI'm finding myself gravitating more towards this crypto over Bitcoin, and that's mainly due to Ethereum's price. I'll explain my chart along with what I'm anticipating.
What am I anticipating?
Price is currently breaking a key lower-high on the weekly, which happens to also be the same area as the monthly (key) lower-high. Once that bull candle closes pass those levels at the end of today then the weekly turns bullish.
Normally, price would run into an old key area in order for the retracement phase to begin. I'm looking for bull continuation to spike the A.T.H. and $5000 price point followed by a correction right into my area of interest (A.O.I.).
Do I have a "special" price within the A.O.I.?
I actually do! $2400.
In conclusion, I'm merely a spectator until the bears enter the market to drive price down, and if that doesn't happen due to bull momentum, I'll readjust.
M - 🐻
W - 🐻 *If today's candle closes above the key LH, it turns 🐂*
D - 🐂
H4 - 🐂

CRYPTO - ALSO WORK WITH THE SYSTEMETH - also some examples to see that when the rules are followed - crypto also works.

ETHUSD - M pattern with target of 2100-2400 usdM pattern with target of 2100-2400 usd
We have to be prepare for 2100-2400 usd and for bitcoin 42.000-44.000 usd
M pattern classic.
It is just my opinion.
Good luck!!!

My ETH Bounce price will be...Honestly, I think Ethereum is just going through a supply and demand process. It's also being affected by the bear market that Bitcoin is experiencing. My bounce-back price will be around $2750 no more. I consider it an excellent entry point if you're interested in a swing

Ethereum - Bearish OutlookThe bearish cycle is still underway. More downside potential is in the pipeline. A breakdown below the key-level support of $3355 will most likely lead to further drop towards the next big support at $3215.

(ETH) ethereum "arrays_new cycle drift"Both Ethereum and Bitcoin had run their course through the timeframe of about 12 days for each of the 9 different sections of the arrays. As the arrays get lighter and more faint the price gets closer to reaching the moment of regenerative investment. The price of both Ethereum and Bitcoin were so close to the most faded section of the array. I kept waiting wondering if it was the moment for when I should place a spot, or many. Then the array was found to reignite into a darker array with almost no change in price, huh? Such dramatics to keep guessing about. If I know this and they know I know this they must not be using this so now I need to find the thing they are using or make a new one of these.

Bullish Outlook for Ethereum (ETH/USD)COINBASE:ETHUSD
In this chart, we analyze the weekly price action of Ethereum (ETH/USD) using Elliott Wave Theory. The chart shows a clear wave structure, indicating potential future price movements.
Wave A (2022 Downtrend):
Ethereum experienced a significant decline, marking the completion of Wave A.
This wave is characterized by a sharp drop in prices, indicating strong bearish sentiment.
Wave B (2022-2023 Correction):
Following the decline, Ethereum entered a corrective phase, forming Wave B.
This phase shows a temporary recovery but doesn't surpass the previous high.
Wave 1 of C (Early 2023 Rally):
Wave 1 initiates the start of a new bullish cycle.
Ethereum begins to recover, showing a strong uptrend with increasing investor confidence.
Wave 2 (Mid-2023 Pullback):
Wave 2 is a corrective wave, characterized by a pullback in prices.
This wave often retraces a portion of Wave 1, offering a buying opportunity.
Wave 3 (Late 2023 Surge):
Wave 3 is typically the most powerful wave in the Elliott Wave structure.
Ethereum experiences a robust rally, surpassing previous highs and indicating strong bullish momentum.
Wave 4 (Early 2024 Consolidation):
Wave 4 is a consolidation phase, where prices stabilize and form a base.
This wave often exhibits sideways movement, preparing for the next upward thrust.
Wave 5 of C (2024 Bullish Continuation):
Wave 5 marks the final leg of the bullish cycle, leading to new highs.
Ethereum is expected to reach its all-time high (ATH) during this wave, driven by strong market sentiment and fundamental factors.
Subwaves within Wave 5:
Detailed subwaves within Wave 5 show the intricate price movements and corrections.
These subwaves help in identifying potential entry and exit points for traders.
⚠️ This analysis is not financial advice and is intended for educational purposes only. Traders should do their own research and consider their risk tolerance before making any trading decisions.

Bitcoin & Ethereum - Morning Update
Bitcoin and Ethereum Morning Update
Good morning, we are back close to the MarchVWAP on ETH 🚨
Still needs to be flipped for the trend to reverse on the higher time frame, if we get this reclaim we are looking for scalps on some assets but thats for later. This setup on ETH with the multiple retests on the cluster reminds me of another setup on ETH just close before we saw the big increase before the ETF happening. On BTC things are looking good as we held the most important level for now the MarchVAL. But on BTC the MarchVWAP is getting problematic too. We are still thinking that ETH is going to outperforme BTC in the next months in either direction. The 4H close on BTC above the MayVWAP is important and not just a fakeout, if we get a reversal in the next 30min we could be in light troubles but as long the MarchVAL holds everything is fine.
We are looking for possible setbacks before breaching the next key levels on Bitcoin and Ethereum.

Eth could be ready for a major moveEth Daily chart shown here.
Eth is bouncing off a long term support which is also lining up with the 200 simple moving average. It might go to back-test this support before the pump.
RSI is ready to bounce off a rising trendline.
Target for this long is 2,544 which from the expected test is around 50% shown on the infoline.
NFA
Do your own DD
