ETHUSDT LONGThis is just simple trading idea draw into chart using labels and lines. Please use it as educational purpose and you are free to modify any
ETHUSDT trade ideas

ETH/USDTA Cleaner view of the chart, ETH Long
Will be updating potential Bullish / Bearish Scenarios after Candle close tonight.
Still Bullish on ETH
Happy Trading.
Just a quickupdate :)
T.

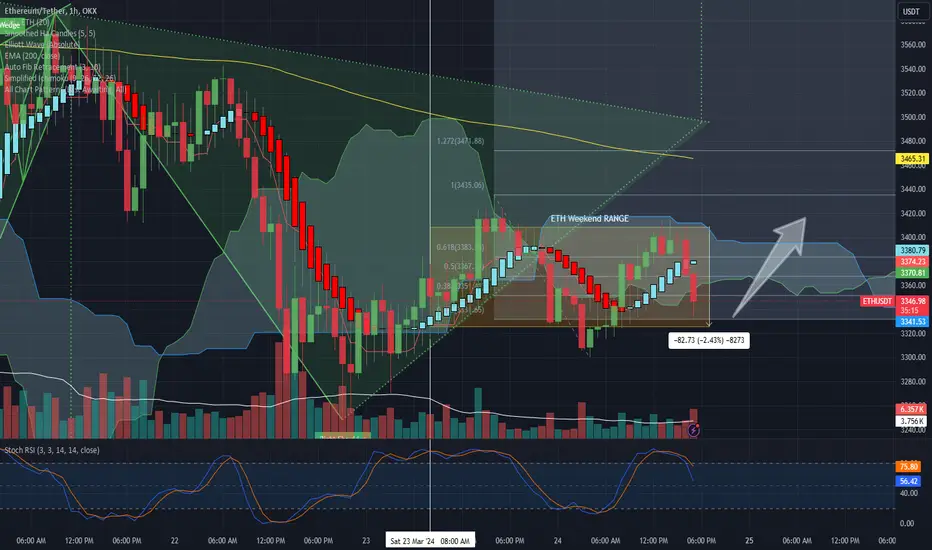
ETH/USDT LongStill Bullish on ETH After this boring weekend of usual weekend antics and boring ranges, (DOGE Apart!)
Eth looking like it could Push again ...
Will have to get a bit closer to midnight before we get any real indication of further price action , Still think ETH has gas in the tank!
Happy Trading.
T.
More indicators than Friends. haha
above 400%According to my experience this chart with considerable features, it hits 20000$ in short term.
I always delete my favorite indicators.

#ETH WEEKLY TIME-FRAME UPDATE!CRYPTOCAP:ETH #Ethereum Weekly Chart Update:
ETH faced rejection from the $4k resistance on the weekly timeframe, and It has reached a low of $3k and has bounced back to around $3400.
The support level is at $3550, currently it treading below this support but if the weekly candle closes above this level, it can be considered a good sign.
However, if the weekly candle closes below this level, it can trigger concerns, leading to a potential drop to around $2600, in my opinion. It's important to note that whenever ETH has failed to surpass the $4k resistance level, it has experienced significant downturns in the past. For instance, in May 2021, ETH faced a rejection of nearly 60%, and in September 2021, it had a 32% drop.
To determine if history will repeat itself, ETH needs to maintain the $3550 support level on the weekly chart.
So keep an eye on the weekly candle close.
#DYOR #NFA

ETHEREUM RETESTING STRONG SUPPORTSymmetric Triangle Breakout on a strong support zone with Bullish Engulfing candle stick.

ETH is going downETH in daily timeframe hit the Extreme OB and made a minor Structure then we expect it go down from here.
if ETH could close up of the Minor structure high then this analysis will be faild.
Attention : this is not a financial advice and its just my analysis of ETHUSDT 1D chart, DYOR

ETH/USDTBINANCE:ETHUSDT is moving good, the possible target price is a little higher then 2000 USDT. It is the upper border of the downtrend channel.
As you see (zoom out the chart) generally BINANCE:ETHUSDT is within the uptrend channel in weekly TF and the price currently bouncing from middle border.
Not a financial advice, for the study purpose.

ETH Ethereum Potential Correction SoonIf you haven`t bought ETH Ethereum before the rally:
or on the strong support:
Now, at an RSI exceeding 93, it seems we are currently in a bubble.
The previous correction following an RSI surpassing 78 was substantial.
Taking into account the Fib retracement tool, my anticipated price target is $3000.

ETH/USDT 1HInterval Chart ReviewHello everyone, let's look at the 1H ETH to USDT chart, as we can see the price is approaching an attempt to break out of the triangle marked in yellow.
Let's start by setting goals for the near future that we can include:
T1 = $3,452
T2 = $3,576
T3 = $3,665
AND
T4 = $3777
Now let's move on to the stop loss in case of further market declines:
SL1 = $3,307
SL2 = $3227
SL3 = $3097
AND
SL3 = $3097
Looking at the RSI indicator, we can see that it remains in an upward trend, while when we look at the STOCH indicator, it looks like a return to price correction is possible.

ETH -bias short Bearish indications:
Triangle pattern break down.
LLLH
Evening star candle formation from the triangle.
Ab=CD indicates possible downwards movement until 3083
Trade plan bias short @ 3314
SL:3382
TP1:3236
TP2:3173

ETH is out from the Ascending Triangle! Targeting $4400🚀Hello, everybody! Today, I'm going to analyze the ETH/USDT pair on the daily chart!
1) We can clearly see that ETH has formed a successful Ascending Triangle pattern, and the price has broken above the resistance level.
2) The Ascending Triangle has now been established! I would like to see the completion of ABCDE waves before the breakout for added strength, but the price momentum is showing a good upward trend.
3) For approx 1.5 years, the price was stuck in the range of $1000-$2000 per ETH, forming an Ascending Triangle. The price sequence squeezed within this Ascending Triangle, and after 1.5 years, the price broke to the upside! Imagine this as a significant upward accumulation zone we're now breaking out from, signaling a big move ahead. The Ascending Triangle's target is approximately $4400 per ETH.
4) We've also employed the MACD indicator! It appears very bullish right now and seems ready to explode. We have a BullishCross above the Histogram's zero line, which is bringing us more upward momentum.
If you like this analysis, please hit the like button and subscribe :)


ETHUSDTETHUSD
We are faceing a ressstance becouse of the fib level if it brewakes then we will going to tap 1900 keep eyes on it .
ETHis this some kind of hint or just a thought, does it really trying to make some kind of inverted Head and shoulder pattern,, lets see what market will do.

Cryptolean Ethereum ETH UpdateEthereum was unable to break bullish through a minor daily resistance of $3,531 and the price pushed to the key support at $3,275.
A bearish break-out of $3,275 will push ETH price lower to $2,800.
ETH has to move bullish and break through $3,8 in the daily chart for another bullish extension towards $78,223-$82,353.
Boost once read!
Thank you.

ETHUSDTExpecting this for next upcoming days let's see these are just facts and figures. Let me know boys still learning about this new price action thing.

ETH In FluxEthereum has had some very turbulent weeks. For one, its price has finally been rallying. After months of underperforming versus new-narrative chains like Solana, Ethereum had started to steadily approach its All-Time High. One of the drivers of the excitement: The Dencun upgrade was introduced last week. The upgrade reduced the transaction costs for Ethereum Layer 2s, such as Arbitrum, Base, and Optimism. Transaction costs on Ethereum Layer 2s can now, in theory, start competing with Solana costs. The popularity of Coinbase's own Layer 2, Base, grew substantially over the past week, even causing an outage of Coinbase's Smart Wallet.
Another positive news is the excitement around a possible Ethereum ETF. One of the applicants, Fidelity, has added Ethereum staking to its ETF application. If the SEC accepts staking, then funds that stake will likely be able to charge no fees for their Ethereum ETFs. They would then subtract the yield of staking from the return on the fund. This would be a big deal. However, odds for an ETF approval in May are dropping fast.
This comes in the wake of what is the bad news: the SEC has been issuing subpoenas to crypto companies including the Ethereum Foundation. Clearly, the organisation sees its last chance to put decentralised finance back into the box approaching. The case mainly revolves around Ethereum's switch to a "Proof-of Stake" consensus algorithm which, supposedly, makes it more similar to an investment contract and therefore to a security. Luckily, the SEC has a poor track record when it comes to taking crypto companies to court. Nonetheless, this has somewhat dampened market enthusiasm.
But in what is maybe the most long-term exciting news for Ethereum, BlackRock filed a document with the SEC last Thursday for an Institutional Digital Liquidity Fund called BUIDL. Securitize will act as the fund's broker. The funds investment strategy is to invest in tokenised assets on Ethereum. The fund's wallet on the Ethereum blockchain holds 100 million USDC available for investment. Currently, there is no information available on the exact investments that will take place within the Ethereum eco-system. But that the largest asset management firm in the world openly sets up a fund on-chain is massively bullish.
Ethereum's price has moved up and down along with the news over the past weeks. Is there still hope that the ETF deadline of May will be met with BlackRock's near-perfect ETF approval track record, and BUIDL being launched on Ethereum? If yes, expect Ethereum to go directly to the moon. Either way, we'll find out in 63 days.

ETH Bullish Setup At Low Timeframe 👉 The Price Formed Perfect Bull Flag At 20 Min Timeframe And Exactly Bounced From 1.272% PRZ ,Expect a Breakout From The Trend Line In Near Future Toward a 3715$ Target ,The Setup Is Extremely Bullish

ETHEREUM - Price can make retest of resistance level and fallHi guys, this is my overview for ETHUSDT, feel free to check it and write your feedback in comments👊
Recently price traded in resistance area, which coincided with $3900 level, but later ETH turned around and started to fall in channel.
In falling channel, price broke $3900 level and declined to $3440 level, after which bounced and tried to rise.
Price failed and in a short time declined to support line of channel, breaking $3440 level, which coincided with support area.
Then ETH turned around, exited from falling channel, and rose to $3440 level and also soon broke it.
But a not long time ago price fell to this level, broke it with support line, and at the moment it trades in support area.
In my mind, Ethereum can make retest of resistance level and then continue to fall to $3120
If this post is useful to you, you can support me with like/boost and advice in comments❤️

Cryptolean Ethereum ETH Update Ethereum is struggling to break bullish through a minor daily resistance of $3,531, which could be interpreted as a sign of weakness.
A bearish rejection of $3,531 will push Ethereum towards $3,275 and, if broken to the downside, lower to $2,800.
ETH has to move bullish and break through $3,8 in the daily chart for another bullish extension towards $78,223-$82,353.
Boost once read!
Thank you.

ETHUSDT IDEAHello Traders Hope You Are Enjoying Our Analysis. Today We Will Discuss About ETH
(Update)
The Descending Channel Upside Breakout Has Done In Weekly Timeframe✅
Running In +105% Profit & Expected 200% In Coming Days✍️

ETH - Building Block 🏢Hello TradingView Family / Fellow Traders. This is Richard, also known as theSignalyst.
🏢 Imagine ETH is trading inside a building, and you are currently on the fourth floor.
📌 $3500 is currently your floor/support. For the bulls to take over, we need a break above $3600.
In this case, movement up to the ceiling at $4000 would be expected.
📌 Meanwhile, $3500 is the ceiling pushing the price down to the floor around $3000 - $3100.
Which scenario do you think is more likely to happen? Which floor is more likely to hold?
📚 Always follow your trading plan regarding entry, risk management, and trade management.
Good luck!
All Strategies Are Good; If Managed Properly!
~Rich
