Entry at rebound / pullbackI was trying to get in with my pending sell limit order with my Stop Loss above one of the highs of the current pullback. My profit target is at local low.
(Posted post factum after being stopped out)
EURSEK trade ideas

EURSEK DECLINING WEDGEJust going for a simple 2:1 RR. We'll see, some areas of minor support, wouldn't be surprised if it doesn't hit my target.

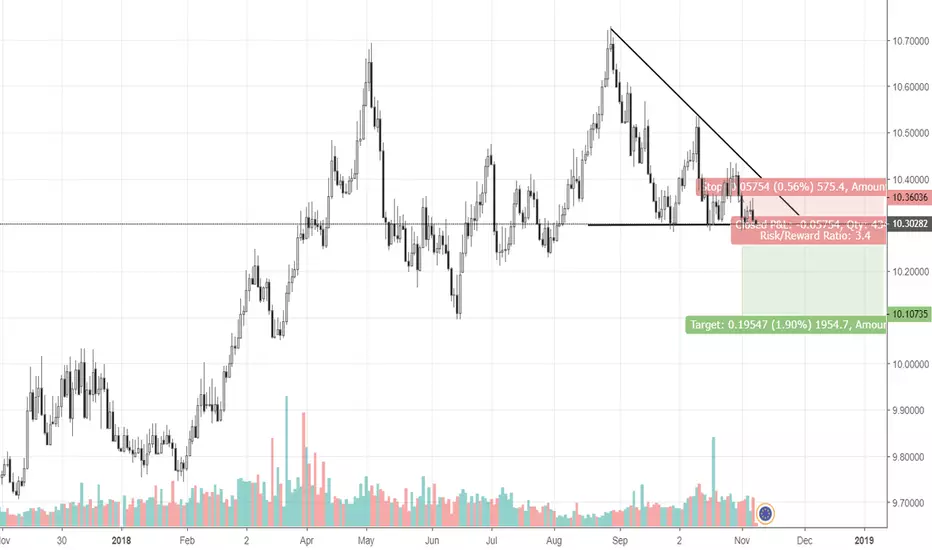
EURSEK | TARGET PRICE 10.10935 | +4R | R-MULTIPLE | SHORTWaited for break and close of candle. Entered after retest of the line.
---- Trade Journal Notes.


Trying again, this time reboundI already tried to get in the breakout of "A" level and the following short-term flag in my previous EURSEK idea. As it's not going without retests, I'm going short now as a rebound from the strong "A" level. Stop loss above "A" level. Profit target around June lows.


38.2% & POSSIBLE 61.8% Retracement LONG GWAVE.38.2% & POSSIBLE 61.8% Retracement LONG GWAVE.
FIB Retracement Percentage is calculated in a Higher Cartesian and or Euclidean Dimension.
PLEASE ALWAYS WAIT FOR STOCHASTIC CONFIRMATION!!! THANKS


EURSEK downNice little trade. Trading EURSEK down after clear rejection of higher prices. 1st TP @ 10.25

EURSEK broke major daily support! And possible continuation downEURSEK been trading at this level for a while, where the highs was getting lower and equal lows building pressure for a break below support. That break happened today where we also see a break of the 200 Daily SMA, and i see possible continuation to the downside. This is an exotic pair and have a wide spread so you may need to play it with small lot size. SL could be smaller if you play the 1-4 H TF. Targets as shown in the chart. Happy pips!

Descending triangleGetting in before the breakout of the descending triangle, the reason I get in before the actual breakout is to preserve the risk/reward ratio 1:3 by keeping stop loss at technically appropriate place. Stop loss is above last local high. Profit target is based upon the low on June 14th.
EUR/SEK 1H Chart: Falling wedge in sightThe Euro has been depreciating against the Swedish Krona since the end of August. This movement has been bounded in a falling wedge.
The exchange rate reversed south from the upper wedge boundary at 10.41 at the end of October. Given that the currency pair is pressured by the 55-, 100– and 200-hour SMAs, it is expected that the pair aims for the lower boundary of given pattern located circa 10.26.
However, this move might not be immediate and the pair could re-test the upper pattern line located near 10.36.


EURSEK - Daily - Could be interestingTrade Alert
It looks like we are getting closer to a braking point on EURSEK. The pair keeps holding on to its support zone at 10.288, which is proven to be an important level that is keeping the pair from breaking lower. At the same time, EURSEK is still trading below its short-term downside resistance line. That said, for us to get comfortable with much lower levels, we would need to see a break below 10.288 level, which could open the path towards much lower levels.
On the upside, a break above the aforementioned downside resistance line and a close of the daily candle above the 10.435 barrier, could invite more bulls to the table an we could see the pair traveling higher.
Always have your SL in place.

EURSEK -- CURRENT POSITION -- Been in this trade for about 8 weeks. Double Top with RSI Divergence. I need it to break 10.29073 and the .618 fibonacci resistance.


EURSEK - Daily - Watch it.Trade Alert
EURSEK is testing the long-term upside support line drawn from the low of the 9th of October. As long as it remains intact, we could see the pair reversing back up again. But for now, we will stay put, as we can see that the pair is sitting between two key levels: 10.435 on the upside and 10.288 on the downside. If one of these is broken, we might start looking for other levels in the direction of the break.
Please see the chart for details.
Always have your SL in place.

EURSEK: Low gradient 1W Channel Up. Long.EURSEK is trading on a long term 1W Channel Up on a low slope (RSI = 51.043, ADX = 12.316, MACD = 0.049) that is near pricing a Higher Low (Highs/Lows = 0.0000). We are looking to utilize the next medium term bullish leg towards a Higher High. TP = 10.80000.

EUR/SEK shortDowntred channel un EUR/SEK, you can clearly see that on a daily outlook bears have the longer dicks. Also check Hanging man and shooting star candlesticks.

EURSEK / Technical Analysis / LONG Gypher forming.EURSEK / Technical Analysis / LONG Gypher forming.

38.2% & POSSIBLE 61.8% Retracement SHORT GWAVE.38.2% & POSSIBLE 61.8% Retracement SHORT GWAVE.
FIB Retracement Percentage is calculated in a Higher Cartesian and or Euclidean Dimension.
PLEASE ALWAYS WAIT FOR STOCHASTIC CONFIRMATION!!! THANKS

38.2% & POSSIBLE 61.8% Retracement SHORT GWAVE.38.2% & POSSIBLE 61.8% Retracement SHORT GWAVE.
FIB Retracement Percentage is calculated in a Higher Cartesian and or Euclidean Dimension.
PLEASE ALWAYS WAIT FOR STOCHASTIC CONFIRMATION!!! THANKS

EUR/SEK 1H Chart: Bearish momentumThe Euro has been appreciating against the Swedish Krona after the currency pair reversed from the Fibonacci 38.20% retracement at 10.32. This movement has been bounded in a short-term ascending channel.
Currently, the pair is trading the lower channel line at 10.36. Also, the pair is pressured by the 55-, 100– and 200-hour SMAs located in the 10.39/10.45 range. Given these facts, it is expected that a breakout from the channel might occur in the nearest future. Technical indicators for the 4H and 1D time-frames support bearish scenario.
Potential downside target could be the weekly S1 at the 10.29 mark.
