EUR/SEK - intraday and next day BUYstrong support at 10,53 was tested 2 times. bulls win. open road to 10,7 after macd 1 hour BUY signal
EURSEK trade ideas

EURSEK - daily 61.8 test, short entryTechnicals
- 61.8 Fib level T/P zone for EURSEK buyers
Trade plan
- Enter short, S/L relatively tight
- 10.35 breakout level is the target
- Scale out on H4 around 10.40 and see if it goes further south

a micro analysis on eursekfollowing our last analysis on eursek where we expect a big drop, we expect eursek to behave the very same way it did the last two peaks before drop last months. to target the exact point of reversal during those endless ascending move (generally heralding an important reversal) we want to see two things :
1) the upper bollinger band on 4h time frame must draw an upper parabolic maximum
2)the price curve must in a last attempt (typical stop loss hunting) impulsively touch this point and reverse immediately
regarding how eursek is near of such a situation this should take place this monday or at the latest thursday with a flat monday to bring confusion first.
we shall do nothing before seeing that, if it crosses badly this upper bollinger band we won't be caught, if it falls even without doing so we won't believe in the reality of the fall, experience on eursek tells us to be cautious and act if and only if those two conditions are met before

eursek, all or nothingeursek has been perfectly bouncing on a support 3 times with a bounce losing intensity each time it hit the support, then it broke and started confidently a down move inside a new channel below. of course now we have through a perfect alignment a retest by below of this previous support, exactly at this point the DMI reaches an extreme value, we do not see how eursek can do anything else than dropping sharply now, this move is also supported by what we see on noksek, usdsek, eurnok and eurusd. this is very simple, if eursek surprisingly cross confidently the 1.53 1.54 area, we will see it coming very soon and then we freeze everything, the loss will be minimal, otherwise we can short eursek massively from where it stands


EURSEK 6 RRR shortTrading Methodology:
1. An asymmetric bullish/bearish pennant is drawn using ascending and descending curved trend lines with a minimum of three price action touche points per line. The direction is determined by the previous trend.
2. The angle tool is applied from the earliest two trend touch points, beginning at the earliest touch point.
3. A trend-based Fibonacci retracement triangle is drawn starting from the earliest trend touch point and ending at the earliest touch point of the opposite trend line .
4. Based on the degree, of the earlier defined angle, the appropriate (and secret) levels are selected for the fibonacci retracement ; two levels for stop-loss and two levels for take-profit. The closest stop-loss level to the current price level is the top priority stop-loss. Though the secondary stop-loss level is often chosen for some markets such as FX and some equities in order to account for seldom unexpected resistance breaks. The greater target level is the top priority, and where majority of the shares are sold, though some may choose to close part of the position at the first target level or set it to be the stop-loss once price exceeds it. Entries should be laddered in around the levels closest of the yellow line.
This trading strategy can be applied to any market and time frame, and positions most often garner the greatest risk-to-reward ratio with the highest success rate. What more can you ask for? I will only be posting my unique trading strategy until EOY. I work solely with price action to identify pennants and apply unique trend-based fibonacci retracement levels for SL and TP levels. Reach out to me if you have any questions.


Target Price 10.43368; 10.53431 For EURSEK Wedge PatternLook for a buying opportunity at Support Level 10.29937.
Or:
Look for a buying opportunity at Wedge Line Level 10.27384.
Key Targets are 10.43368 and 10.53431

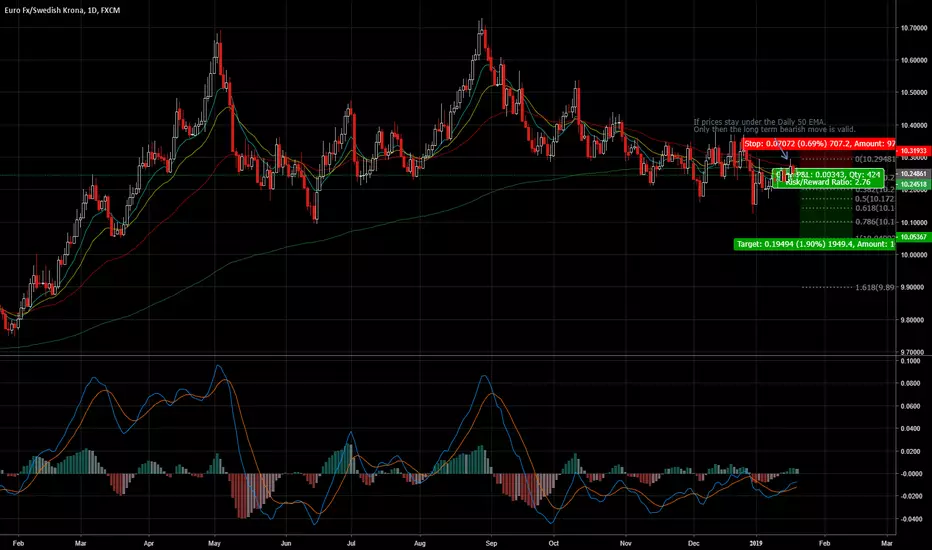
EUR/SEK - LONG TERM BEARISH OPPORTUNITYIt's been 5 months now since EUR/SEK has been sailing under the Daily 50 EMA.
It has now also broken the Daily 200 EMA.
What we can expect to happen next is a complete breakout of the 200 EMA and the beginning of a long term bearish move.
The confirmation that we need is for the price to fail to move and find support back above the Daily 200 or 50 EMA.
If it successfully consolidates under it, then we have a go for a push higher down.
This is my own analysis. You should never ever, even if it's the most profesionnal trader, take his words blindly. Do your own analysis and enter the trade on your own terms.
Trade safe.
eur/sek short double topdouble top formed after an up trend . buyers are showing less interest. trend change possible

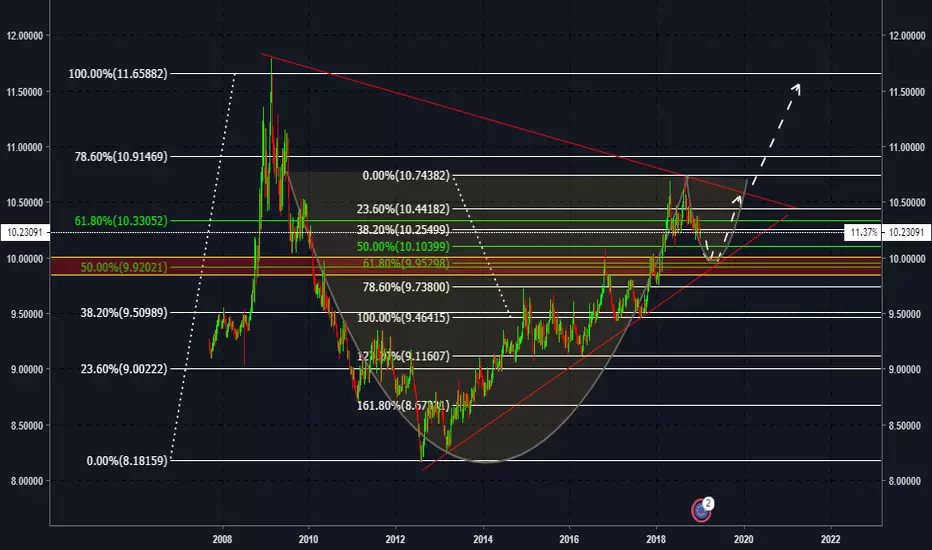
EUR/SEK Analysis of Multiple ConfluencesI would first like to preface that this analysis is simply for educational purposes and does not constitute a signal. With this idea, I would like to touch on the topic of confluences. When performing technical analysis on pairs in the forex market, it's great practice to study confluences in the market. What are confluences? Confluences are levels in the market where there is more than one indication that a particular price point is of certain interest for a buy or a sell. Although not a guarantee of a buy or a sell, these areas should be watched closely for action of price. Price can be impacted by a variety of factors, including fundamentals. Given this, only after studying and obtaining confirmation should a trade be entered. In this example for EUR/SEK, I see a few confluencing factors as follows:
1. Taking a fib on two separate time frames we see confluence of fibs on both the 50% and 61.8% levels. This area is highlighted. We see zone that is of particular interest.
2. We also can draw trendlines and see confluence between the price point of these fib levels and the respect of the trend line.
3. I have done some further research to study that the fib levels as noted happen to fall at historical key levels in the market.
4. Although the market does not have to follow particular patters, if price followed through as indicated, price action would closely follow that of a cup and handle pattern.
Study such as this is very helpful for strengthening one's technical analysis. I invite you to study this with me, watch price action and take notes along the way.
Again, this is not a signal but simply for educational and study purposes. If you decide to take this trade, use proper risk management and trade at your own risk.
EURSEKEursek is making triangle.As if it might go up
This is not a investment idea just my analysis.

EURSEK: 1D Channel Down/ sell signal to 10.070.The pair is trading inside a Channel Down on 1D and the current neutrality (RSI = 47.632, Williams = -49.587, CCI = -47.5862, Highs/Lows = 0.0000) indicates that a Lower High level has been reached. Based on the previous Lower Low measurements, we are short on EURSEK targeting 10.07000.


EURSEK Broke Major Support, Potential DropThis is a 4H chart for FX:EURSEK
Probability : Short
Price broke a very important support and retested it after finding some minor support around 1.2125 this doesn't seem to hold, SL around 10.4500 and target will be 10.0000
Updates will be available later.
This is not a signal, it's just my opinion, Good luck

EURSEK is not ready! Hurry Up and Wait!EURSEK : Price is consolidating. It will break out very soon. The double top indicates it may break out to the downside, however we need to wait for confirmation because price is at a very strong support level. EURSEK

Ascending triangle intraday Got in after the breakout of the ascending triangle as the price was retesting the horizontal price level of the triangle. Stop loss was under one of the triangle's local lows. Profit target is around November 30th highs.
(Posted post factum)

EURSEK OutlookFOREXCOM:EURSEK This is currently in a strong uptrend, however a reversal may occur after it reached the previous high (Peak to the left). It is best to allow this to run and put on a short position after the support level is broken. Will still need to watch and make sure there is no bounce on the lower trend line.

EURSEK Longthere is a possible head and shoulders. for confirmation, need to close a candle above the neck-line. until the closing above the neck-line I do not open a position


Christmas Gift--Sell--EURSEKAnother opportunity to short, don't be fooled. Every pull back a selling opportunity with first targets at 10.00, sell at 10.291, stops at 10.35

EUR/SEK 1H Chart: Two scenarios likelyThe EUR/SEK currency pair has been trading in the falling wedge since the middle of August. Also, the pair has reached the lower boundary of the long-term ascending channel.
Currently the rate is testing the lower channel line at 10.22. If given channel holds, a reversal north occurs in the nearest future and a breakout north from the wedge follows. Potential upside target is the Fibonacci 23.60% retracement at 10.45.
If given channel does not hold, the pair continues to trade within the wedge. A possible breakout north from given pattern might occur near the 10.15 mark.

Long EURSEKTrading above the bearish channel so Buy at 10.30 SL 10.26 TP1 10.33 TP2 10.345. Follow me for trade updates. Please like and share if you agree on this idea.
