#FET ultra highframe This is super long term chart for #FET, looking at long term accumulation, breaking above resistance making new ATH's is extremely good sign.
THIS IS SUPER LONG TERM & SHALL BE ONLY FOR INVESTORs, not looking to trade this for few %
FETUSDT.P trade ideas

Let's try this again - FET ShortFET has hit a 6.85 just as it did in its last market cycle top. I think that from here there is a chance that it dumps down to the 2.618 area as an initial dump. This is approximately around $1.22.
Once this initial dump takes place, it will likely do a nice bounce back upwards, which typically sets up another dump/short opportunity. This bounce will probably take us back up to around $2.50. So a nice long opportunity within a short opportunity. If this plays out as it did last time, you should be able to short down to around 57 cents. So first short - about 60%, counter trend long - 100%, second short op - 73%. That's IF this plays out the same way as it did last cycle.
If we just continue bullish - my next upward target is $4.52.

Fetch.ai (FET) to print 70% correctionSince August of last year price action has risen to provide a 1700% return as forecast (long idea below). A number of reasons now exist to appreciate long risk far outweighs reward.
On the above 8 day chart:
1) Price action has arrived at legacy resistance in the uptrend channel. Look left. This is also true for the FET.btc pair (below)
2) As with previous corrections price action prints a bearish engulfing candle following a strong up trend.
3) Everyone on tradingview.com is bullish, remember 90% of market participants lose money.
www.tradingview.com
Is it possible price action continues in uptrend? Sure.
Is it probable? No.
Ww
FET Long idea, August 2023
FET.btc 8 day pair

Possible Double Bottom on FET/USD Daily ChartIf you're seeing a double bottom pattern forming on the daily chart of FET/USD, it could be a sign of a potential trend reversal. Here's what a double bottom typically indicates:
Price Decline: The price falls to a support level (bottom 1), then rallies but fails to break significantly above a resistance level.
Retest and Support: The price declines again (bottom 2), ideally retesting the previous support level (bottom 1) or forming a slightly higher low. This retest demonstrates buying pressure at that price point.
Breakout: If the price breaks above the resistance level (neckline) connecting the two bottoms, it suggests a potential trend reversal from downtrend to uptrend.
Target Price Based on Double Bottom:
The technical analysis concept suggests a price target can be projected by measuring the distance between the neckline and one of the bottoms and adding that distance to the breakout point. In your case, if the neckline breakout occurs and the target is $3+, then the measured distance between the neckline and the bottom would be the difference between the target price and the current breakout price.

FET retest strong support !FET / USDT
Price is bouncing hard from old resistance zone which is turned into support now
this support wasn’t formed in days or weeks but in years between 2019-2024 Which make it very strong support zone and with important indicator
As long as this support is holding the sentiment is extremely bullish
Important note : FET will merge with OCEAN and AGIX and will turn into ASI token soon
Best of wishes

Quickie on FETOpened a long at current prices, expecting a push into 2$ next week, prob. tue/wed.
Stay safe!

Alikze »» FET | Wave 3 or C bullish scenarioIn the daily and weekly time, after an upward cycle in the supply area, a complex mixed correction has been corrected to the 0.38 Fibo range of the previous wave, after which it faced demand.
🔰In the lower time, it went through a full cycle up to the green box area, which again grew up to the current area after a correction.
🔰If this wave is extended and breaks the resistance zone, it can continue to climb to the next zone, but if it encounters supply in the current zone, a correction cycle can be carried out to the previous major ceiling zone and then the continuation of the upward cycle. to do in the form of a large wave 3.
If the behavior and structure of the post changes, it will be updated.
»»»«««»»»«««»»»«««
Please support this idea with a LIKE and COMMENT if you find it useful and Click "Follow" on our profile if you'd like these trade ideas delivered straight to your email in the future.
Thanks for your continued support.
Sincerely.❤️
»»»«««»»»«««»»»«««

FET/USDT JUNE - 2024The market correction presents a prime buying opportunity as panic selling sets in. We've been patiently waiting for this moment. FET is now on our radar, with two identified buy zones ready for accumulation!
Remember, this is a spot trade—not a leverage trade. We carefully select and buy our coins in spot, aiming for massive gains without the stress of leverage and the shakeouts happening across the crypto market. While there's potential for further dumps and shakeouts, we're ready to hold our position as long as these two levels hold. However, be prepared for the possibility of losing the last line of support if the situation worsens.
-----------Disclaimer --------------------
This is not financial advice. Please do your own research and consider your risk tolerance before making any investment decisions.
It's crucial to manage your funds wisely. If the market loses the main support area, especially on the weekly chart, be prepared to exit your positions. However, stay alert for potential shakeouts - temporary drops that regain support—which can provide opportunities to re-enter the market.
Remember, the strategy for taking profit isn't about hitting an exact number. Instead, we focus on areas of possible resistance. As we approach these areas, we move our stop-loss orders higher, allowing us to follow the price action toward higher targets. This method helps secure profits as the rally progresses.
Always have a plan for both entry and exit points. By adhering to these strategies, we aim to optimize our trading outcomes and secure massive profits.
Successful trading involves understanding the rules and executing them with discipline. Stay focused, manage your risks, and be ready to capitalize on market opportunities.
Happy trading!

Long Term Fet prediction! Weekly chart (Hopeum Edition)Please feel free to zoom in and out of the chart for better clarity. For quite some time I was stuck in 4 hourly daily charts. Given the current situation ,I personally avoided checking larger weekly time frames for quite some time until now. I am not saying we are out of the bag yet!!. It still feels like this bottomless well is sucking us in. Then I said to myself wait, this is how we are supposed to feel just before the tide changes direction.
I felt the same when btc hit around $4000 last time. When zoomed out of the weekly chart, I noticed that only 2 buy signals generated(many common buy indicators are lighting up at the same time)
First time this happened was back on march 9 2020 ish from that point price went up to ~1.2$ (roughly 11000% growth) I took these numbers as a reference point and also assumed supply increased by 6 folds over the last couple years. I estimated that during the next bull run $fet could possibly grow roughly 2000% percent .

ASI - Fetch AI Downtrend on the short-term and until mergerThe price has been consolidating after its all time high. Sell pressure is pretty high.
The 50 and 100 Moving Averages have crossed after hitting the SELL Order Blocks at ATH getting us a selling volume of over 167M and 83M (A, A2).
Price has broken through the small buy OBs (B2) and it's headed towards the OBs which I marked with A3 and B. With the upcoming merger (sometime hopefully this year if the team is actually being serious about this whole ordeal and won't disappoint degens with further delays.)
Conclusion: Even though the price seems to be in a confirmed downtrend, I'm staying hopeful and thinking about a good scenario: once the fat OBs at B gets filled (539.683M) and if the merger will be in any way successful - price is gonna turn hard erected with green bars towards astronomical gains. Partnership with Deutsche Telekom is also VERY based, I'm wondering if they're going to be utilizing Agents as Customer Support or if the use cases would go out to be more complex than that. Either way, price actions stays negative until we reach the bottom OBs.
What's your thoughts on ASI/FET? Where do YOU see it heading price-wise?


FET priceThe price action signifies that the token has signalled a positive buy signal and trapped the seller army.

FETUSDT UPDATE#FETUSDT(Update)
Hey dear traders. Hope you are enjoying analysis with our team. we are here to analyze FETUSDT today.
21% Profit Done ✅✅
Incase of Breakout the Descending Channel Expecting Massive Bullish wave📈🚀

FETUSDT still on the bearish trend. FETUSDT is still on the bearish, but retracement is incoming soon. Before the bearish trend continue

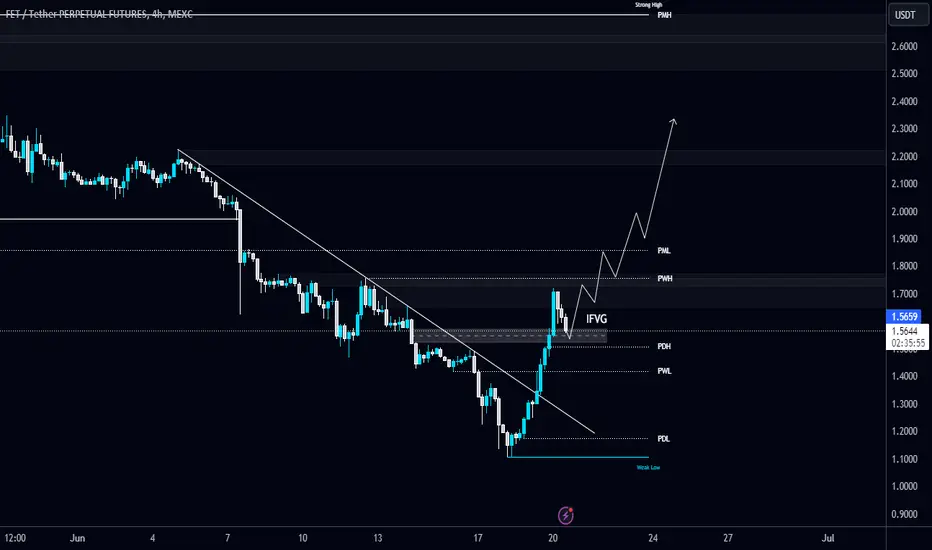
#FET/USDT breaks the Diagonal Trendline and currently testing IF#FET/USDT breaks the Diagonal Trendline and currently testing IFVG in 4-Hour TF!
I'm expecting a bounce from here. The breakdown of this IFVG will invalidate the trade. The local resistance level is PWH $1.76.
FET multiple bullish divergences....Multiple Divergences on $FET!
After the local downtrend, a bottom is going to be in this area.
Patience.

FETUSDT IDEAHello Traders Hope You Are Enjoying Our Analysis. Today We Will Discuss About FET
(Update)
The Descending Channel Formation On 12H Timeframe☑️
Now Its Ready To Breakout⏳
In Case Of Successful Breakout Expecting Massive Bullish Wave✍️

FETUSDT UPDATE#FETUSDT(Update)
Hey dear traders. Hope you are enjoying analysis with our team. we are here to analyze FETUSDT today.
Falling wedge formation in 1D time frame.
Retesting is in process✍
Incase of upside Breakout Expecting Massive Bullish wave📈🚀

#FET is currently at 0.618 fib level, which is important..Almost every altcoin fell during yesterday's market dump! I expect the price to hover around this level for some time or even dip slightly to take out the liquidity below, gathering the necessary momentum to start a new uptrend.
Holders will make it. Traders, not so much. :)

FETCH AI Before mergerJust an idea I still need to develop further, as you can see fetch has had a beautiful runup until this point. It's a big question if it will follow the same pattern after the merger, but just in case it does continue on this track - we can use this chart to further explore the upwards channel.

FET ANALYSIS (1D)According to the FET, it is inside the large C wave and this wave is a large diametric. It seems that we are at the end of the e wave of C.
From the red range it can drop in the medium term to complete the big F wave to the green range.
Closing a daily candle above the invalidation level will violate the analysis
For risk management, please don't forget stop loss and capital management
Comment if you have any questions
Thank You

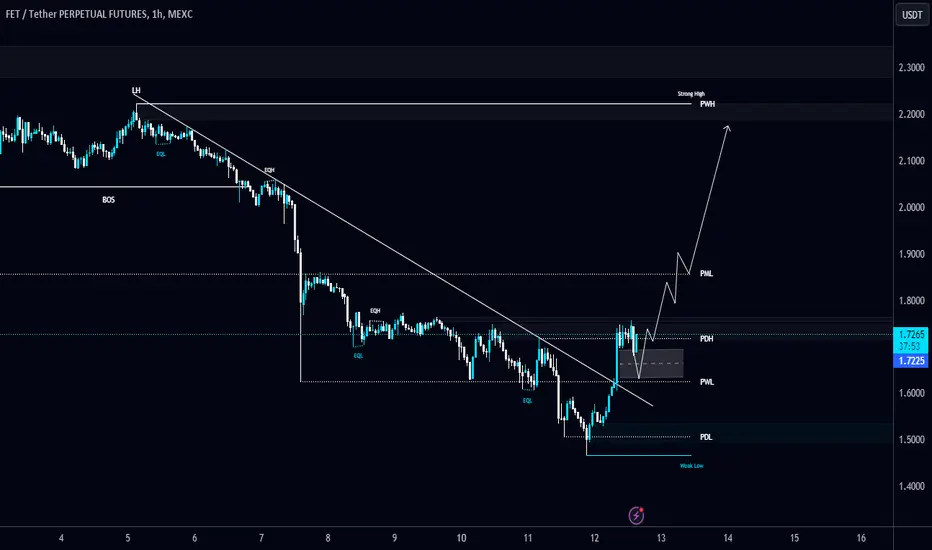
#FET/USDT breaks the Diagonal Trendlien in 1-Hour TF!#FET/USDT breaks the Diagonal Trendlien in 1-Hour TF!
Keeping an eye on mid-level of the FVG, I will wait for confirmation to open the Long position. The local resistance level is PML $1.8585.
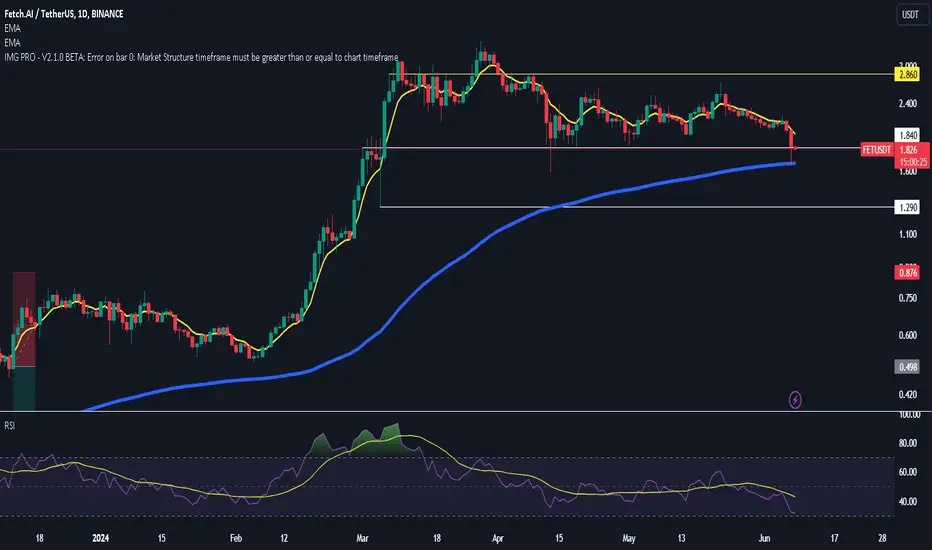
$FET reclaim white line or go for liquidity below 200 ema then pop
either way watching for now
rsi looks to be reset...almost