NAS100 trade ideas

NAS100: First red day on the backside moveHi everyone and welcome to my channel, please don’t forget to support all my work subscribing and liking my post, and for any question leave me a comment, I will be more than happy to help you!
“Trade setups, not movements”
1. DAY OF THE WEEK (Failed Breakout, False Break, Range Expansion)
Monday DAY 1 Opening Range
Tuesday DAY 2 Initial Balance
Wednesday DAY 3 (reset DAY 1) Mid Point Week
Thursday DAY 2 ✅ Day 3 cycle
Friday DAY 3 Closing Range
2. SIGNAL DAY
First Red Day ✅
First Green Day
3 Days Long Breakout
3 Days Short Breakout
Inside Day
3. WEEKLY TEMPLATE
Pump&Dump ✅
Dump&Pump
Frontside
Backside ✅
4. THESIS:
Long: N/A I'm not interested in any long setup, neither counter trending the backside on Thursday
Short: primary, market on the backside move, dumping down with nice bearish momentum. Lower low placed into the LOW, looking for a sell high opportunity at 9:30am NYO or 10:01am after major red news release.
Please note that the purpose of my analysis is to help me and you hunting the best trade setup for the day, none of my technical aspects are a way to forecast any directional market movement.
Gianni

NASDAQ BUY LEVEL @18734.4Another potential trade on NASDAQ. we looking to this trade only it brake level of 18734.4 than we will take our buy position.

NASDAQNASDAQ: Sell
Open: 18660
SL: 19000
TP1 : 18000
TP2 : 17700
TP3 : 16700
================
Disclaimer: Any content in this text does not constitute investment advice. This text provides an objective description of the market situation and should not be considered an offer to sell or a solicitation to buy.
Any decisions made based on the information provided in this text are your personal responsibility. Any investments made or to be made should be analyzed based on your financial situation and personal goals.

Nasdaq 100 (CME) may fall to 18240.00 - 18430.00Pivot
18760.00
Our preference
Short positions below 18760.00 with targets at 18430.00 & 18240.00 in extension.
Alternative scenario
Above 18760.00 look for further upside with 18880.00 & 18980.00 as targets.
Comment
As long as 18760.00 is resistance, look for choppy price action with a bearish bias.
Supports and resistances
18980.00
18880.00
18760.00
18543.80 Last
18430.00
18240.00
18000.00
Number of asterisks represents the strength of support and resistance levels.

Competitive Markets are CompetitiveNice surprise today! I shorted at bell ring but not holding it. Closed after hours.
For the swingers, you're dead already.
For the noobs, you're wrong.
For the intraday warriors, it doesn't matter, you'll make money no matter what.
Competitive markets (BIG MARKETS) hunt liquidity.
Breakouts from ascending channels retest.
That means your ludicrous stop loss and "I know what the market should do" mentality will get you raked over the coals. Only the fittest survive.
The market is full of pavlovian dogs. "They" ring the bell, you come running in, salivating.
You say "the market only goes up!" because you got a cookie every time you said it.
And to all the confident shorts on the breakdown, you think you know what the market should do. It should go down. Respect the market. It will go and hunt your stop and humble you first.
I expect absolutely MINT trading conditions. Market will likely drop, build liquidity higher on the short interest, and go jab it out for a final hurrah and H+S setup. Maybe even higher again? There is always that last rip up where you think "oh yeah it just goes up forever" because you're the last, most basic schtick, you hold the very top of the the market when every fund has sold every position to ever simp on earth hoping to get rich.
But M2 is expanding, so maybe just so much money will be printed and spent by the US gov't that it looks like you are winning as inflation lifts all markets all the more, without any real gains.
Because there are so many chartists utterly detached from reality, I do expect some nice rallies in the downtrend. I'll keep selling into you on the rips. I'm sorry if that's you, but I appreciate the liquidity in those moments.
Expect the unexpected. Greed is in the market but the smart money is spending to get the market up only so they can sell it back after the lift.
"We'll just sell to those breakout idiots." - Quote from an actual fund manager.

Nasdaq - Soon heading to $30.000?Hello Traders and Investors, today I will take a look at the Nasdaq .
--------
Explanation of my video analysis:
For more than a decade, the Nasdaq index has been trading in a rising channel formation with the last retest of the support trendline being back in the end of 2022. At the moment, Nasdaq is retesting the upper resistance trendline and if we actually see a breakout over the next 2 months, we might see a similar rally of +50% compared to the one which we saw back in 2020.
--------
Keep your long term vision,
Philip (BasicTrading)

NAS100: First green day, three days cycleHi everyone and welcome to my channel, please don’t forget to support all my work subscribing and liking my post, and for any question leave me a comment, I will be more than happy to help you!
“Trade setups, not movements”
1. DAY OF THE WEEK (Failed Breakout, False Break, Range Expansion)
Monday DAY 1 Opening Range
Tuesday DAY 2 Initial Balance ✅ day 3 cycle
Wednesday DAY 3 (reset DAY 1) Mid Point Week
Thursday DAY 2
Friday DAY 3 Closing Range
2. SIGNAL DAY
First Red Day
First Green Day ✅
3 Days Long Breakout
3 Days Short Breakout
Inside Day
3. WEEKLY TEMPLATE
Pump&Dump
Dump&Pump ✅
Frontside
Backside ✅
4. THESIS:
Long: primary, market potentially coiling for an explosive move back to the HOD or HOW, I will take this trade in consideration if buy 10am NYT the price action will be auctioning down low into the current LOD.
Short: secondary, is not the trade I'm interested today, but I can see a potential pump and dump starting from Friday LOW. If the market will keep breaking down for a pump and dump into the Friday CP, or market pumping back up into yesterday CP/HOD, then a sell high could also be an interesting alternative.
Please note that the purpose of my analysis is to help me and you hunting the best trade setup for the day, none of my technical aspects are a way to forecast any directional market movement.
Gianni

price could go up higher anthor 500 points based on the fibonacci retracement tool i use price hit all the way down to 50% off and i bought at 37% of

Nasdaq Index Shows Uncertainty Ahead of PCE ReleaseNasdaq Index Shows Uncertainty Ahead of PCE Release
The main event of the week is the release of the Personal Consumption Expenditures (PCE) index, which the Federal Reserve particularly focuses on when assessing inflation in the US. The release is scheduled for Friday at 15:30 GMT+3. As this important event approaches, rumours and trader expectations about the news increasingly impact the current price on the stock market.
According to ForexFactory, the Core PCE Price Index on a monthly basis is as follows:
→ forecast for Friday = 0.3%.
→ previous value (a month ago) = 0.3%;
→ value two months ago = 0.3%.
These figures indicate stable inflation, but surprises are not ruled out, which could certainly lead to a spike in volatility.
The price of the Nasdaq index (US Tech 100 mini on FXOpen) has decreased since the beginning of the week – this may indicate market participants' uncertainty about whether inflation will decrease. Meanwhile, as CNBC reports, the president of the Federal Reserve Bank of Minneapolis, Neel Kashkari, believes that the Fed should wait for significant progress in combating inflation before lowering interest rates.
In his opinion, rates could potentially even be raised if inflation fails to decrease further. “I don’t think we should rule anything out at this point,” Kashkari added.
Technical analysis of the Nasdaq index (US Tech 100 mini on FXOpen) chart shows that:
→ the price is in an uptrend (shown by the blue channel);
→ the 18840 level is acting as resistance (indicated by the arrow).
Note the behaviour of the Nasdaq index price (US Tech 100 mini on FXOpen):
→ the upward impulse A→B was sharp, but it failed to hold above the 18840 level;
→ the upward impulse C→D is less sharp, judging by the slope of the trajectory. After overcoming the 18840 level, the price formed a rounding pattern (a sign of demand deficit) and decreased (confirmation of weakness). Notably, the price did not reach the upper boundary of the channel (shown by the red circle).
Today, the price is near the median line of the ascending channel, which could lead to some consolidation in anticipation of the news. If the news indicates a slowdown in inflation, we might see a new attack on the 18840 level; otherwise, the Nasdaq index price (US Tech 100 mini on FXOpen) could decrease to the lower boundary of the current channel.
Trade global index CFDs with zero commission and tight spreads. Open your FXOpen account now or learn more about trading index CFDs with FXOpen.
This article represents the opinion of the Companies operating under the FXOpen brand only. It is not to be construed as an offer, solicitation, or recommendation with respect to products and services provided by the Companies operating under the FXOpen brand, nor is it to be considered financial advice.

NAS100: Inside dayHi everyone and welcome to my channel, please don’t forget to support all my work subscribing and liking my post, and for any question leave me a comment, I will be more than happy to help you!
“Trade setups, not movements”
1. DAY OF THE WEEK (Failed Breakout, False Break, Range Expansion)
Monday DAY 1 Opening Range
Tuesday DAY 2 Initial Balance
Wednesday DAY 3 (reset DAY 1) Mid Point Week ✅ potentially still day 3 cycle
Thursday DAY 2
Friday DAY 3 Closing Range
2. SIGNAL DAY
First Red Day
First Green Day
3 Days Long Breakout
3 Days Short Breakout
Inside Day ✅
3. WEEKLY TEMPLATE
Pump&Dump
Dump&Pump ✅
Frontside ✅
Backside
4. THESIS:
Long : primary, a buy low setup, back to the previous HOW, would be a really interesting opportunity to complete a two week dump and pump template. However, news till 10:30am, everything will be taken after all the MRN
Short: secondary: the inside day signal, is typically either a trend continuation or reversal, depending on how the 3 session Asia, London and NY setup. I do not exclude a reversal after major red news. Price currently on the HOW
Please note that the purpose of my analysis is to help me and you hunting the best trade setup for the day, none of my technical aspects are a way to forecast any directional market movement.
Gianni

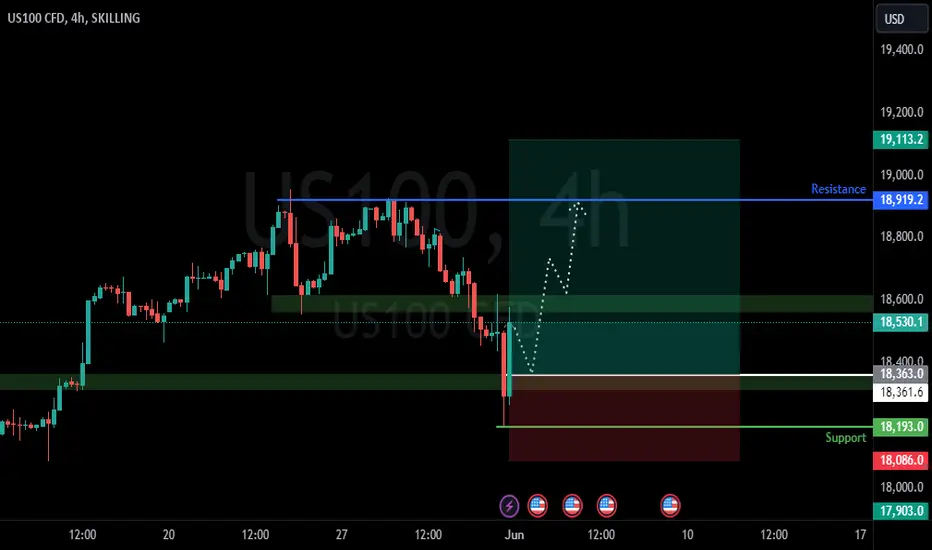
Nasdaq PlayBook SetUp IdeaExpecting price to drop at Sunday open 18,580 and then find support 18,500. From 18,500 on the 1 Hour Time Frame we can expect some buying pressure to 18,800. Cloning the bullish Move that started from 18,200 to 18,600 which was a 400 points move. We can now Project another Bullish move from 18,500 to 18,900 which happens to Hold some supply levels and also some liquidity.

NASDAQ Another 2 weeks of consolidation possibleNasdaq (NDX) made the bullish break-out that we largely expected as described on our previous idea (May 15, see chart below) and almost hit our 19100 Target:
Right now we see a short-term pull-back, which based on the November - December 2023 fractal (green ellipse), should be at worst a 2 week consolidation. The 1D RSI also shows that symmetrically we should be at a point similar to December 06 2023.
That fractal then rose for a Higher High on the 2.236 Fibonacci extension. As a result, our medium-term Target is now set at 19900 (just under the 2.236 Fib and top of the 1.5 year Channel Up).
-------------------------------------------------------------------------------
** Please LIKE 👍, FOLLOW ✅, SHARE 🙌 and COMMENT ✍ if you enjoy this idea! Also share your ideas and charts in the comments section below! This is best way to keep it relevant, support us, keep the content here free and allow the idea to reach as many people as possible. **
-------------------------------------------------------------------------------
💸💸💸💸💸💸
👇 👇 👇 👇 👇 👇

NAS100USD: Potential Buy Opportunity for NY SessionGreetings, Traders!
Brief Description🖊️:
Currently, institutional order flow on US100 is bullish, therefore we are looking for price to take sell stops in order for a turtle soup trade condition (false break).
Things I Have Seen👀:
Bullish Institutional Order Flow📈: Anticipating price to continue to the upside after sell stops have been taken. Smart money will look to order pair (buy against the sell-side liquidity).
Potential Sell Stops🔄: Price may take sell stops before buying, presenting a turtle soup condition (false break of structure). After sell stops have been taken, I will look to take a confirmation entry.
Bullish Targets📉:
Daily FVG: The primary target.
M15 Bearish Order Block: The secondary objective, with an expectation to fill the liquidity void there.
What's Important Now❗
Stay observant for price action around these key levels to confirm bullish continuation.
Best Regards,
The_Architect

NAS100 Will Grow! Long!
Please, check our technical outlook for NAS100.
Time Frame: 4h
Current Trend: Bullish
Sentiment: Oversold (based on 7-period RSI)
Forecast: Bullish
The market is approaching a significant support area 18,679.71.
The underlined horizontal cluster clearly indicates a highly probable bullish movement with target 18,824.15 level.
P.S
The term oversold refers to a condition where an asset has traded lower in price and has the potential for a price bounce.
Overbought refers to market scenarios where the instrument is traded considerably higher than its fair value. Overvaluation is caused by market sentiments when there is positive news.
Like and subscribe and comment my ideas if you enjoy them!

Nasdaq the channel/tl resistance levelThe Nasdaq is again going to face an important and a very old tl/ channel resistance level a reason of this sudden strong move, will add monthly and weekly levels in the comment section also the 12M levels

NAS100 I Sentiment remains bullish I watch for these key areasWelcome back! Let me know your thoughts in the comments!
** NAS100 Analysis - Listen to video!
We recommend that you keep this pair on your watchlist and enter when the entry criteria of your strategy is met.
Please support this idea with a LIKE and COMMENT if you find it useful and Click "Follow" on our profile if you'd like these trade ideas delivered straight to your email in the future.
Thanks for your continued support!Welcome back! Let me know your thoughts in the comments!

US100 BUYNasdaq is at final buy zone worthy position use sl ...
If break the point never look for buy
Trail sl every 35 pips

Free fall soon?Nasdaq broke the multi month ascending channel, and now seem to retest the zone where the channel broke in the first place, which is a good area for bears to enter the market with a good RR.

bearish pressureUSNAS100
- Tendency :
the price is under bearish pressure 18,675
- Turning level :
The turning level is at 18,675 where price has now stabilized at the bottom
- resistance level :
Breaking the turning level 18,675 , the price will up to 18,795 and 18,885
- support level :
The trading stabilizing below 18,675 the price will reach the support level of 18,490 and 18,325
- corrective level :
price will attempt in 18,675 correct itself before falling

Good analysis and advice, hope to help you!Have a great weekend, guys
for the new month i am expecting prices to pullback at least to the 18000
Reasons :
1. Bullish Engulfing on the 1M timeframe
2.50% fib retracement at 18000
3.Trend line at 18000 psychological level
Happy trade

NAS Weekly Idea 5.28.24My Usual Setup that I didn't publish... still has some interesting levels to play out.
