DJIA trade ideas


US 30 - Ranges overview (update) And just like that we end the month and take out the HTF buyside liquidity.
Just another end of the month...the weekend and a new week starting for a new month is awaiting us.
I hope you guys had a nice month and that your trading went alright.
As always whatever your bottom line for the month...it is simply a reflection of this month. Next month will be another month of new opportunities and trades. Don't forget RISK MANAGEMENT is your best friend..regardless of your profits.
Been a good month and some nice trending trading so let's see how we close the month...and what the market has in store for us traders next month.
Stay safe and never risk more than 1-5% of your capital per trade. The following analysis is merely a price action based analysis and does not constitute financial advice in any form.
Short Weekly Based on technical and price action analysis, the US 30 is expected to be short on a weekly timeframe, potentially dropping to 32,500.

DOW JONES (US30) LONGS NOT BAD IDEADuring the uncertainty and risk off environment, low GDP data didn't come unnoticed and big boys accumulated some equities after the huge Salesforce panic.
Today, with NASDAQ loosing almost 2% and 0.7% for SP500, DJ was accumulated, so I think we might see nice and strong reversal for the end of the week and month close.
Play safe and good luck!

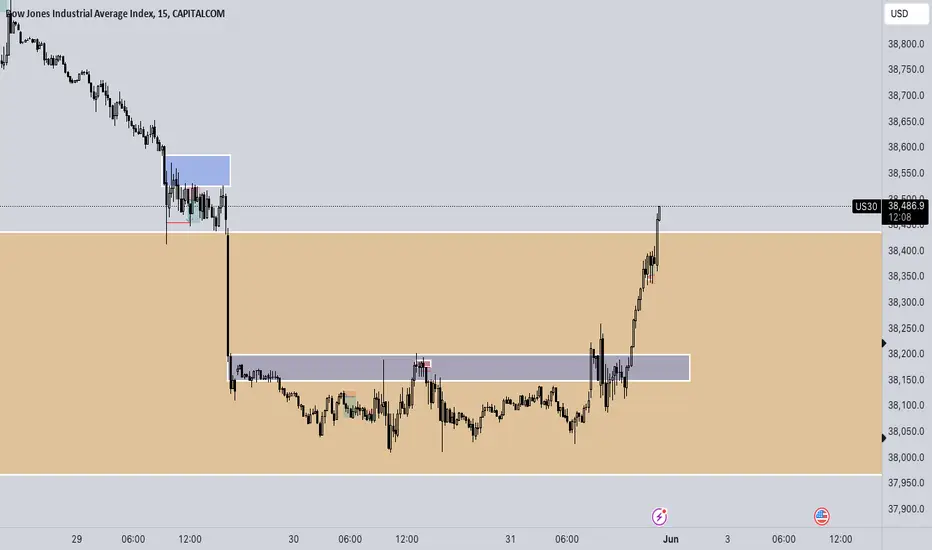
US 30 - Ranges overview (update) The 30min imbalance held and we've taken the buyside liquidity.
Let's see how we move further from here.
As always don't chase the market..let it come to you and ACT UPON IT
Stay safe and never risk more than 1-5% of your capital per trade. The following analysis is merely a price action based analysis and does not constitute financial advice in any form.
US30 BULLISH CONFIRMATION!!The bullish strength formerly develop is currently active as price trades at $38,153 level. A buy opportunity is envisaged from the current market price .
Target is 38,491

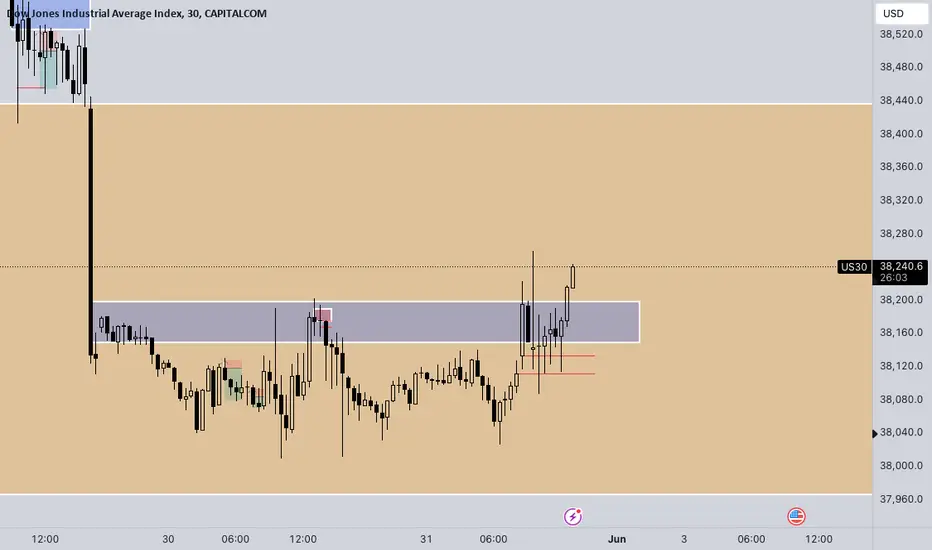
US 30 - Ranges overview Here is a quick look at the current range on US 30
We are currently trading back within the 30min imbalance. We've taken out the buyside and still respecting the HTF FVG (blue box)
IF we fail to close below the current lows expect us to hunt the buyside and continue going higher
IF we fail to hold these current levels we should expect some further downside towards the sellside liquidity.
It's Friday so keep your RISK MANAGEMENT in check and don't fumble your CAPITAL
Stay safe and never risk more than 1-5% of your capital per trade. The following analysis is merely a price action based analysis and does not constitute financial advice in any form.
DJ30 in H1 consolidation / Support Resistance DeviationsI will try to go for buys, when price reaches the hourly floor. We have an Intraday zone above and hourly resistance beneath.
Careful, the top is still dominant. Use RSI to get an entry, if you buy, wait until it has hit the floor 2 or 3 times and shows clear momentum upwards (candle close with few pip distance from zone means rejection, candle close touching zone various times means acceptance and might rather break the zone)
Use 200 pip SL today and RSI for fine tuning of entry.
Note to zones: You see that support and resistance are a little deviated from each other. This is always the case, buyers show support at the floor support zone, while the higher support zone is currently not active at all. This is why we only see clear resistance at the top.

possibility of uptrend It is expected that the downward trend will end in the current support range and we will see the beginning of the upward trend.
According to the behavior of the indicator, possible scenarios have been identified

US30 H4 | Bearish reversalBased on the H4 chart analysis, we can see that the price is rising toward our sell entry at 39,355, which is a pullback resistance.
Our take profit will be at 38,761, an overlap support level.
The stop loss will be placed at 39.839, an overlap resistance level.
High Risk Investment Warning
Trading Forex/CFDs on margin carries a high level of risk and may not be suitable for all investors. Leverage can work against you.
Stratos Markets Limited (www.fxcm.com):
CFDs are complex instruments and come with a high risk of losing money rapidly due to leverage. 68% of retail investor accounts lose money when trading CFDs with this provider. You should consider whether you understand how CFDs work and whether you can afford to take the high risk of losing your money.
Stratos Europe Ltd, previously FXCM EU Ltd (www.fxcm.com):
CFDs are complex instruments and come with a high risk of losing money rapidly due to leverage. 70% of retail investor accounts lose money when trading CFDs with this provider. You should consider whether you understand how CFDs work and whether you can afford to take the high risk of losing your money.
Stratos Trading Pty. Limited (www.fxcm.com):
Trading FX/CFDs carries significant risks. FXCM AU (AFSL 309763), please read the Financial Services Guide, Product Disclosure Statement, Target Market Determination and Terms of Business at www.fxcm.com
Stratos Global LLC (www.fxcm.com):
Losses can exceed deposits.
Please be advised that the information presented on TradingView is provided to FXCM (‘Company’, ‘we’) by a third-party provider (‘TFA Global Pte Ltd’). Please be reminded that you are solely responsible for the trading decisions on your account. There is a very high degree of risk involved in trading. Any information and/or content is intended entirely for research, educational and informational purposes only and does not constitute investment or consultation advice or investment strategy. The information is not tailored to the investment needs of any specific person and therefore does not involve a consideration of any of the investment objectives, financial situation or needs of any viewer that may receive it. Kindly also note that past performance is not a reliable indicator of future results. Actual results may differ materially from those anticipated in forward-looking or past performance statements. We assume no liability as to the accuracy or completeness of any of the information and/or content provided herein and the Company cannot be held responsible for any omission, mistake nor for any loss or damage including without limitation to any loss of profit which may arise from reliance on any information supplied by TFA Global Pte Ltd.
The speaker(s) is neither an employee, agent nor representative of FXCM and is therefore acting independently. The opinions given are their own, constitute general market commentary, and do not constitute the opinion or advice of FXCM or any form of personal or investment advice. FXCM neither endorses nor guarantees offerings of third party speakers, nor is FXCM responsible for the content, veracity or opinions of third-party speakers, presenters or participants.

Dow in 12H chartHello everyone
I am not surprised for this recent news regarding Israel and Iran political problems and start a new war but I am, it is better to say, that I hope this war will be a fake news to make the market a dip and this problem might be solved soon. A human do not like to make money from a war.
If my estimate is correct so we will see a shallow correction for market and then it rises again.
Time wil disclose it so soon my friends.

My bottom/date scenario prepared for the Dow Jones."My expectation for the 2026 bottom region of the Dow Jones, which I have been anticipating since last year, and the momentum it will gain afterward is as follows. My chart covers the next 10 years and beyond. I have made my purchases under the current circumstances, and if my anticipated bottom scenario materializes in late 2025 and early 2026, I will make my second purchase.
Note: My charts reflect my own ideas."

A note to Risk Management and Exit StrategyI had a message and was inspired to speak my mind about correct risk management.
What is it? How can I use it? How does it serve me?
First of all, positions with no SL are a really bad idea, I don't care what bankers do. It is not cool or useful at all.
Depending on how refined your strategy is, you will be struggling with higher Exits in your beginnings.
Risk Management for Beginners:
Start with an 1:1 Risk Reward. Which means, exit all positions at the same amount where your Stop Loss would have been. It is the safest and fastest option until you know enough about the markets to aim for more. If not, most of your trades will land in BE and your losses will hurt even more. Trust me, I've been there.
Risk Management for advanced traders:
When your general win quota has reached about 70-90%, your account will not necessarily will be growing. Because we are humans and always will do some stupid experiments in between, whether we feel too safe with a bad idea, or want to try something new.
Its time to set 2-3 Exits. Use multiple positions, so you can leave them running.
2 Exit Strategy (50% at Exit 1 and 50% at Exit 2)
3 Exit Strategy (25% at Exit 1, 50% at Exit 2, 25% at Exit 3) This way you secure 200% with every successful trade.
Risk Management for Pros:
You can aim for higher exits minimize your Stop Loss. When you know where to find an Exit5 or Exit 10. Never reenter the same trade, the first idea is always valid.
Have a 4 Exit strategy without variation on the amount of risk per trade, and take an extra open trade for higher positions. Always know what your target is. (25% at Exit 1, 25% at Exit 2, 25% at Exit 3, 25% on the open position).
Do never vary the amount of your risk. Be aware that emotions do not matter and there is no difference in between trades. All aim to be profitable, otherwise we would not be trading. If you decide for 0.5% or 1 or 5%, it doesn't matter, just do not vary ever. Down or upscale slow, very slow.


US30 Market Shift: Bullish Targets and Key Liquidity ZonesGreetings, Traders!
Brief Description🖊️:
Currently, US30 has presented a market structure shift (MSS). Before this shift, we observed the price taking H1 sell stops, indicating that smart money has paired orders. This MSS suggests the potential for bullish institutional order flow. The price has since pulled back into an M15 bullish order block.
Things I Have Seen👀:
Market Structure Shift🔄: The price has shifted, signaling potential bullish institutional order flow.
Order Block Support📈: The price has pulled back into an M15 bullish order block.
Liquidity Void🕳️: Yesterday's price action left a significant inefficiency (liquidity void). Today's trading will aim to fill this inefficiency, with the draw on liquidity targeting the last point of efficiency, the H1 bearish order block.
Bullish Targets📉:
H1 Bearish Order Block: The primary target for filling the liquidity void.
What's Important Now❗
We need to observe today's price action to see if it fills the inefficiency and reaches the H1 bearish order block.
Best Regards,
The_Architect

US30 Bias fairly bearish for a short term till we drop back down to 38600 area . follow the arrows for directional market flow . look for sells inside the supply area and hold till we get to 38600 area

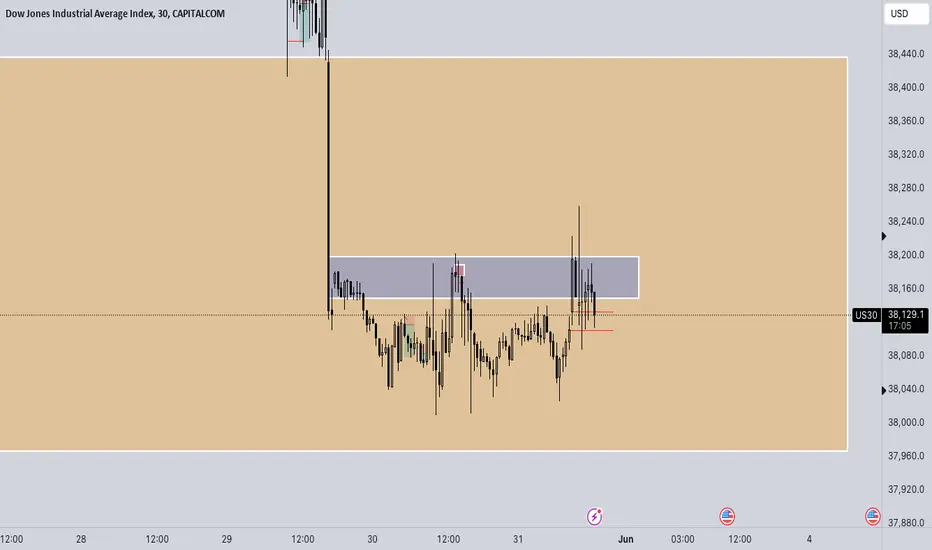
US 30 short - swing trade (update) We've taken the daily sellside liquidity (red line) so let's see where we go from here.
The market trapped the bulls at the NY open and hunted the sellside liquidity we noted earlier today. You'll note how we traded into the 15min FVG (blue box) before trading lower.
Will be interesting to see IF we break through the HTF sellside (yellow box)
No need to RUN AFTER THE MARKET...let it come to you and be PATIENT
Stay safe and never risk more than 1-5% of your capital per trade. The following analysis is merely a price action based analysis and does not constitute financial advice in any form.

Dow Jones (US30) LONG worth a risk ?After big dump over last days that was overextended after yesterday's Saleforce earnings, the DOW finally is in the demand zone worth a risk.
On smaller timeframes we can see some demand building with Change of character and breaks of structure.
I opened long with a potential for a return to 39700 based on the new GDP data released, that is favoring interest rate cuts.
Stay safe and good luck :)

DJ30 FORECASTThe forecast for the Dow Jones 30 is now leaning towards a bearish trend. Prices are expected to fluctuate between 40050 and 39564. However, if the 4h candle closes below the pivot line at 39,564, the bearish pressure is likely to continue, potentially driving prices down to 39400 and 38825.
Key Levels:
Bullish Line: 39825, 40050, 40285, 40500
Pivot Line: 39564
Bearish Line: 39400, 39075, 38825, 38445

DJ30 dipping into the ocean150 pip SL. DJ30 is looking for a new floor again, it was consolidating around the last area. I have not looked for possible resistance areas. You could also take 300 pip exit 1 in here just to be safe...
Also the stop loss is small. A wiggle room of 300 pip is never too bad.
I like to use the hours when the markets are just slowing down, I think volatility will be higher when Asian session opens in about 40 min

US30 (Toward Support Zone...)US30 Technical Analysis
The price dropped from the pivot line at 39,050, as we noted at the beginning of the week. It is currently heading towards 38,500 and 38,400. If the price stabilizes below this support zone, the bearish trend is expected to continue towards 38,020 and 37,820 for the week. Today, the price is anticipated to consolidate between 38,500 and 38,790 until a breakout occurs.
A bullish scenario will be activated if the price breaks above 38,790, targeting 39,050.
Pivot Line: 38,675
Resistance Levels: 38,790, 39,050, 39,350
Support Levels: 38,410, 38,020, 37,820
Today's expected movement range is between the support level at 38,400 and the resistance level at 38,790.
Previous idea:

US30Dow Jones index analysis
1 hour time frame
The price can move to the bottom of the 1-hour range and from there return to the top of the 1-hour range.
