Dow Jones Industrial Average IndexDow Jones Industrial Average Index
it may touch 38650
R1-38650
SL-today clbs
10EMA coross
if 25/04- GDP Rate come, Personal income MoM
DJIA trade ideas

US30USDUS30USD - The Price has given a breakout from Potential Reversal Zone of Bearish Bat Pattern
Sellers will remain in control. Before Reversal, we have observed bearish divergence.

Falling towards 23.6% Fibonacci support?Dow Jones (US30) is falling towards the pivot and could potentially bounce to the 1st resistance.
Pivot: 39,310.89
1st Support: 38,992.16
1st Resistance: 40,075.11
Risk Warning:
Trading Forex and CFDs carries a high level of risk to your capital and you should only trade with money you can afford to lose. Trading Forex and CFDs may not be suitable for all investors, so please ensure that you fully understand the risks involved and seek independent advice if necessary.
Disclaimer:
The above opinions given constitute general market commentary, and do not constitute the opinion or advice of IC Markets or any form of personal or investment advice.
Any opinions, news, research, analyses, prices, other information, or links to third-party sites contained on this website are provided on an "as-is" basis, are intended only to be informative, is not an advice nor a recommendation, nor research, or a record of our trading prices, or an offer of, or solicitation for a transaction in any financial instrument and thus should not be treated as such. The information provided does not involve any specific investment objectives, financial situation and needs of any specific person who may receive it. Please be aware, that past performance is not a reliable indicator of future performance and/or results. Past Performance or Forward-looking scenarios based upon the reasonable beliefs of the third-party provider are not a guarantee of future performance. Actual results may differ materially from those anticipated in forward-looking or past performance statements. IC Markets makes no representation or warranty and assumes no liability as to the accuracy or completeness of the information provided, nor any loss arising from any investment based on a recommendation, forecast or any information supplied by any third-party.

Weekly Forex Outlook Sun.May.19.2024 - Fri.May.24.2024Like and Comments would be appreciated :D Not Financial Advice, Just my outlook/opinion

The Mother Of All Shorts Beckons!Markets have topped out after months of belief that the Fed would drop rates.
The Fed will NOT drop rates until the economy is in recession and the markets collapsing...that is how they function.
An initial selloff into mid April has been met with a weak bounce so far, this is your prime moment to load your shorts and prepare now for the mother of all bear markets.
Most do not see the underlying rot and veneer of manipulation, when all else fails, they take us to war...that is their distraction from the truth.
God Bless you all and good trading!

US30 SHORT IDEA "Seizing the Downturn: US30 Short Trades with High Risk-Reward Potential. These trades are strategically positioned to capitalize on market shifts, offering a clear opportunity for favorable returns amidst downward momentum Look promising as of now lets see where it leads

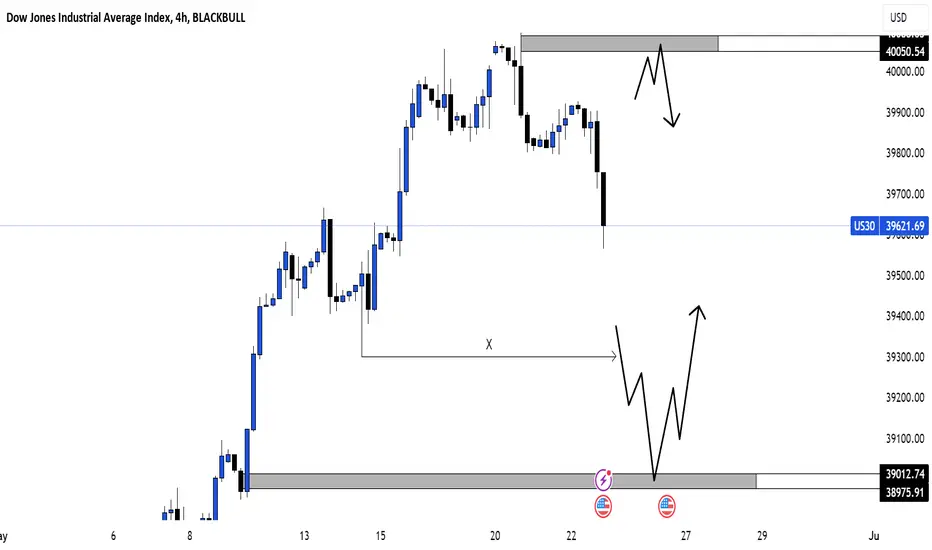
CHART BREAKDOWN US30: Key Levels, Targets and Thoughts!🎯Brief Description🖊️:
The chart provides insights into critical market levels, emphasizing an essential demand zone (medium-risk buy zone) spanning from 39013 to 38975. Additionally, medium-risk sell zone between 40050-40090, respectively, are highlighted.
Things I Have Seen👀:
Medium-Risk Buy Zone🟠: Noted between 39013 and 38975, suggesting another area with moderate risk for potential buying positions.
Medium-Risk Sell Zone🟠: Noted between 40050 and 40090, suggesting another area with moderate risk for potential selling positions.
Bearish Targets📉:
40000: Possible retracement area.
39900: Possible retracement area.
39800: Area with laying low liquidity.
Ultimate Target: 39600- Essential Demand Zone
Bullish Targets📈:
39300: Possible retracement area.
39560: Possible retracement area.
39700: Possible retracement area.
39850: Possible retracement area.
40100: Area with a lot of liquidity.
What's Important Now❗
Currently, the crucial approach is to wait and observe the price action at this level. We need to assess how the market reacts before considering any decisive moves. Stay observant and responsive to real-time developments in the market.
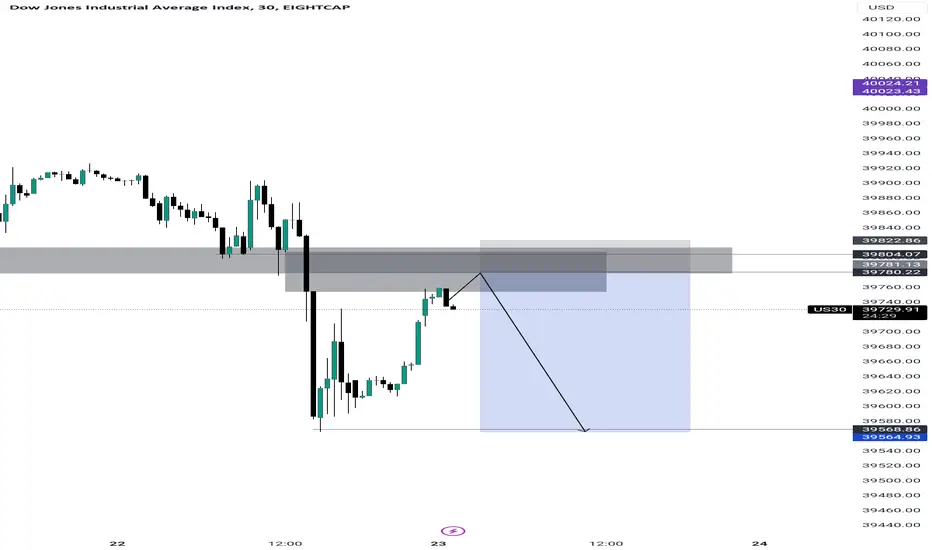
US 30 long - scalp trade Taken a nice scalp based on the 1min inverted FVG. The 4H OB (red line) is currently holding the lows.
Entry 39613
TP 39650
SL 39589
IF we hold the current lows, longs are still open and we will retrace towards the buyside liquidity sitting around 39715 and most likely higher later today
IF we close below the lows and hold we will continue lower later in the day.
Stay safe and never risk more than 1-5% of your capital per trade. The following analysis is merely a price action based analysis and does not constitute financial advice in any form.

US30 IS NOW ON BEAR PUTSOrders Placed, no pending, all executed in time before the market made an impulsive move to the down side.
Aim for a 50% retest zone, then call for buys on corrections, and sell again on impulsive move targeting PSTG 1 & 2

US 30 - Ranges overview (update)And just like that we got the move on US 30.
Hope some of you guys managed to get onboard or LEARNED from the range analysis and the overall market analysis.
Personally tape read the move and will look for a trade after 14:00 (NY TIME) today.
Once again the market moves in RANGES and SEEKS LIQUIDITY. Nothing less...nothing more.
Stay safe and never risk more than 1-5% of your capital per trade. The following analysis is merely a price action based analysis and does not constitute financial advice in any form.

US 30 - Ranges overview (update) Here is a daily overview of the current range we will be looking to trade today.
Overall plans remain the same until proven otherwise.
Stay safe and never risk more than 1-5% of your capital per trade. The following analysis is merely a price action based analysis and does not constitute financial advice in any form.

US 30 - Ranges overviewLet's have a look at the current range we are trading in.
We are currently trading through the weekly sellside liquidity so let's see how the 1H closes.
IF we close below and hold expect further pa to the HTF FVG (yellow box)
IF we fail to close below we will have trapped the bears and the market will hunt the buyside liquidity from earlier today and yesterday
No need to RUN AFTER THE MARKET...BE PATIENT...PLAN AND LET IT COME TO YOU
Stay safe and never risk more than 1-5% of your capital per trade. The following analysis is merely a price action based analysis and does not constitute financial advice in any form.


Us30According to the previous increases, the us30 chart is currently in price correction and it is expected that the price will reach its original position. According to the technical chart, buyers and investors will start buying and the volume of demand will increase, which will increase the price of us30.

Orders The is one of the markets that teach you how to trade.it will create illusions to the point you'll decide to back up quick.i still believe we can catch it

US30 ANALYSIS+ TRADEIt is important that we utilize the higher time frames for direction bias and target the highs or lows where liquidity is found.
ALWAYS trade in the direction of the HTF.
LTF are used to refine your entries.
1. Identify market direction - Daily/4hr chart.
2. Identify your current trading range. -Daily/4hr chart.
3. Get your Fibs retracement tool and draw from the bottom of the range to the top for a bullish market and from the top to the bottom of the range for a bearish market.
4. Identify your discount or premium area.
5. Within your point of interest identify, imbalances, order blocks, fu/ic candles.
Target will be the previous high or low

US30 - WED 22 MAY 24 - TRADE SETUPAMD Setup
Price manipulation to the downside.
The market is likely to deliver to the upside.
21:00 - FOMC Meeting Minutes

US30 neutral 1. we are currently consolidating in a tight controlled price range - this clearly illustrates to me that we are waiting a big price move soon (most likely after the high impact new releases today)
2. i believe a break below the line below wil lead to a bullish continuation upwards or a break below the line above will lead to a short term bearish break down of price to the downside.
Always maintain a open mindset about the outcome of news as nothing is guareteed in the trading market at any time

US30 Will Go Up! Buy!
Take a look at our analysis for US30.
Time Frame: 5h
Current Trend: Bullish
Sentiment: Oversold (based on 7-period RSI)
Forecast: Bullish
The market is approaching a key horizontal level 39,853.77.
Considering the today's price action, probabilities will be high to see a movement to 40,277.47.
P.S
We determine oversold/overbought condition with RSI indicator.
When it drops below 30 - the market is considered to be oversold.
When it bounces above 70 - the market is considered to be overbought.
Like and subscribe and comment my ideas if you enjoy them!

US30 TESTING PREVIOUS HIGHS...With Dow Jones testing previous highs
will it be looking to break above this level and search
for newer highs, or will price decline again like it did before.
The market is currently displaying previous price patterns
that once occurred, on this very same high before price
started falling - signaling a possible bias of history
repeating itself, But if price keeps penetrating
this major resistance we on, we will be expecting
upward movement.

US30 (Sensitive Consolidation Movement )Dow Jones New Forecast
You should see a few more months of inflation data that appear to be falling (before any prices are lowered)
The price corrected to their support line as we mentioned in the previous chart,
so now still has a consolidation between 39790 and 40005 till breaking, from this support line will try to start a bullish trend toward 40005, and above it will get 40130 and more
otherwise closing 4h candle under 39785 means will drop to get 39580
Pivot line: 39790
Resistance Prices: 40005, 40130, 40420
Support Prices: 39570, 39360, 39070
The movement range will be between support 39790 and Resistance 40130
Previous idea:

us30 low probability setupHello traders this is us30 setup with low probability
the risk i will take 0.25%
i will wait for high probability setups
the system : institutional tactics
if you like my idea hit the like button , follow subscribe and show some love
wish you good luck and good trading
