VST NOV-2025VST (1D) — Price rejected 220 and lost 196 supply; holding the primary uptrend near 190. Key absorption base sits at 160–145. A break below 167 is likely to accelerate distribution into the 135 gap and 110. Reclaim of 196 opens 205/215 and a retest of 220.
Targets:
Upside: 196 → 205 → 220
Downside
Key facts today
Next report date
—
Report period
—
EPS estimate
—
Revenue estimate
—
2.40 EUR
2.57 B EUR
18.72 B EUR
335.10 M
About Vistra Corp.
Sector
Industry
CEO
James A. Burke
Website
Headquarters
Irving
Founded
1882
ISIN
US92840M1027
FIGI
BBG00GNYNPY6
Vistra Corp. is a holding company, which engages in the provision of electricity and power generation. It operates through the following segments: Retail, Texas, East, West, Sunset, and Asset Closure. The Retail segment sells electricity and natural gas to residential, commercial, and industrial customers. The Texas and East segments are involved in electricity generation, wholesale energy sales and purchases, commodity risk management activities, fuel production and fuel logistics management. The West segment represents the company's electricity generation operations in CAISO. The Sunset segment includes generation plants with announced retirement plans. The Asset Closure segment refers to the decommissioning and reclamation of retired plants and mines. The company was founded in 1882 and is headquartered in Irving, TX.
Related stocks

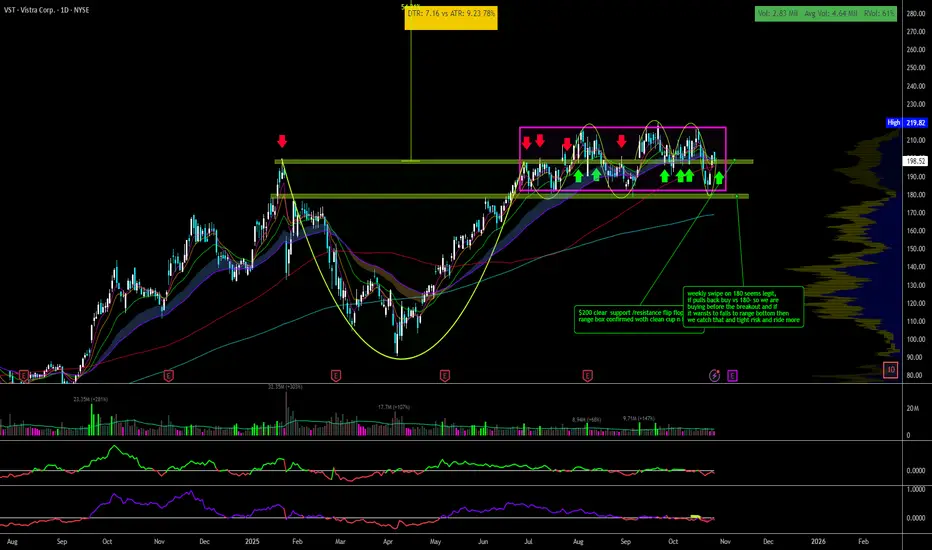
Complicated Cup n HANDLES w Psych 200Love these kind of setups where risk is clearly defined.
Daily level 198-200 and 178-180 are 2 clear levels to risk depending on your entry.
Thesis is the same along with all these HPC and AI story BS, power is needed and hence clear demand and the Chart pattern is clean for me and risk is defined,
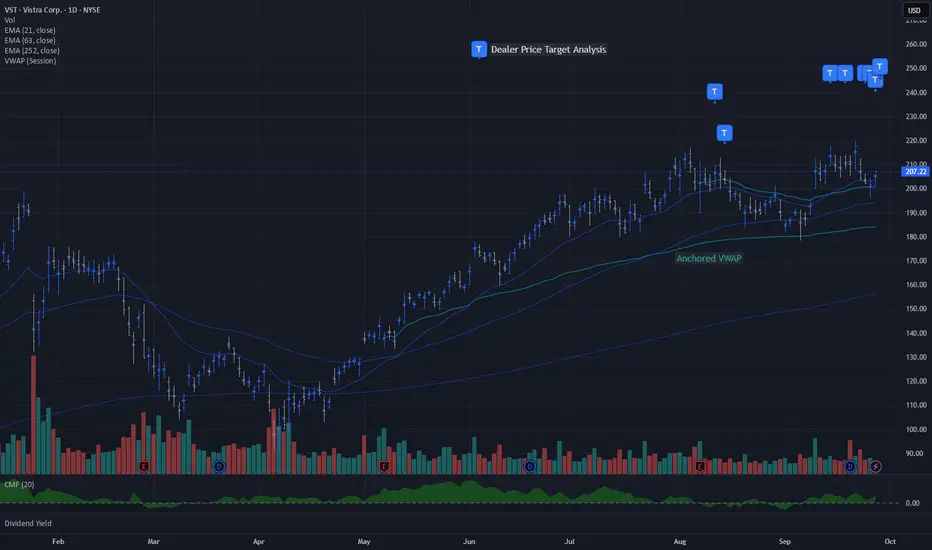
VST Breakout Forming: Dealer Pricing Pull + TechnicalsDealer Forecast: Dealer price analysis targeting $247 with multiple days of institutional impact trading.
Technical Set Up: Strong support at Anchored VWAP and monthly + quarterly EMAs.
Vistra Corp. (VST) Thrives on Steady Power DemandVistra Corp. (VST) is a leading integrated retail electricity and power generation company in the U.S. Through its diverse portfolio of natural gas, coal, nuclear, solar, and battery storage assets, Vistra provides energy to millions of residential, commercial, and industrial customers. The company’

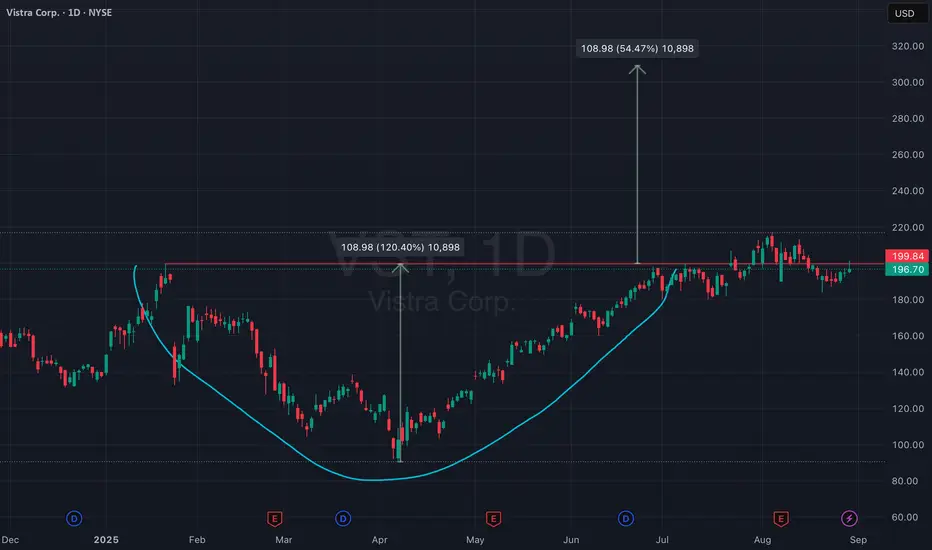
Cup and Handle Breakout Setup – Vistra Corp. (VST)Vistra Corp. (VST) is forming a classic Cup and Handle pattern on the daily chart. The cup formation has developed over several months, with a clear resistance zone around $200 now being tested again.
A confirmed breakout above $200 could trigger the next leg up. Based on the measured move from the
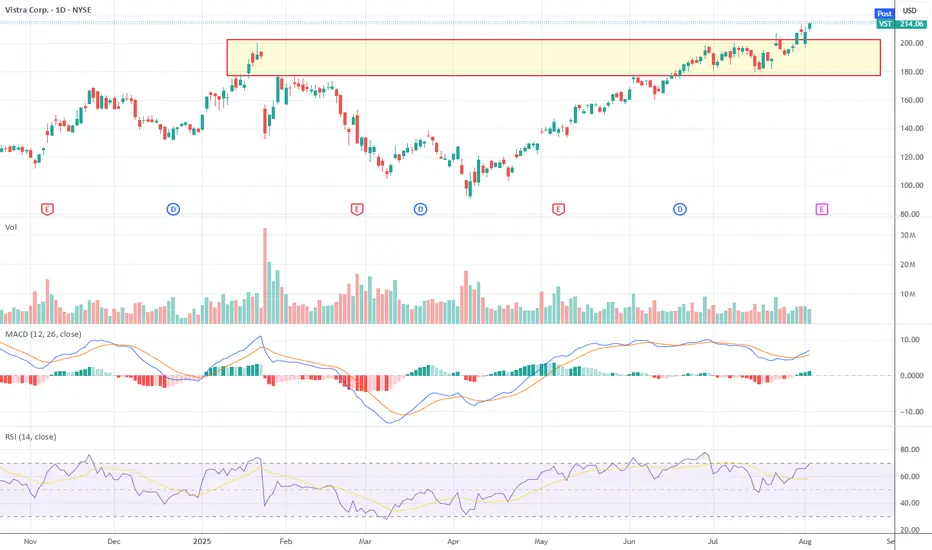
$VST — Breakout Confirmed, Momentum Supports Further Upside
Overview:
Vistra Corp. (NYSE:VST) has broken out of its recent range on the daily chart, supported by rising momentum and a clean bullish structure. The move is supported by volume and follows a textbook continuation pattern.
Price Action & Candlestick Structure
The last 3 daily candles show
Vistra Corp - Uptrend intactVistra NYSE:VST has shown a steady uptrend being intact and is likely to continue higher after prices closes above the bearish gap and made a new high. Volume remain healthy.
Long-term MACD shows steady state of bullish momentum.
Despite showing overbought by our mid-term stochastic oscillator

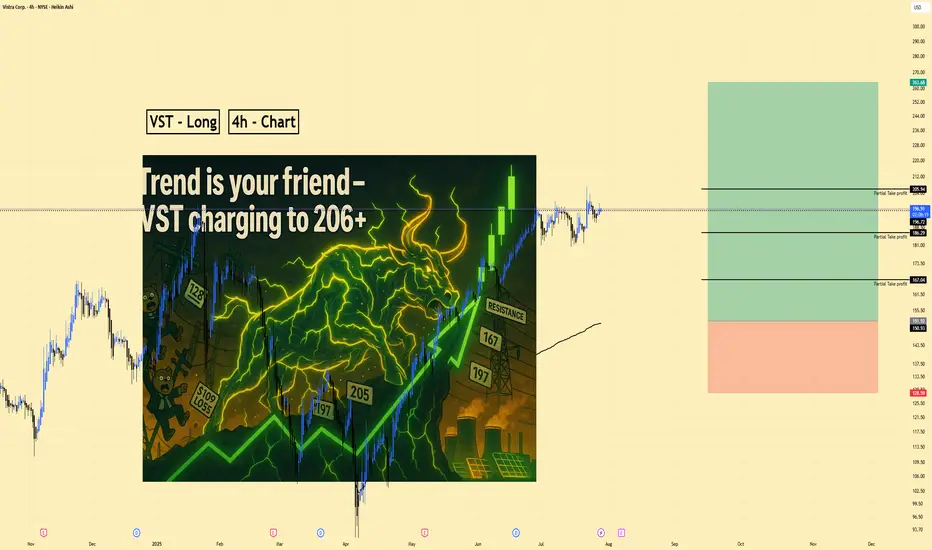
VST | Long | Trend Continuation with Correction Setup (Aug 2025)VST | Long | Trend Continuation with Correction Setup (Aug 2025)
1️⃣ Quick Insight: Vistra Corp. has been in a strong uptrend, making new highs. We are now looking for a healthy correction to position for continuation, as "the trend is your friend."
2️⃣ Trade Parameters:
Bias: Long
Entry: $151 (wa
VST Purchase - Nuclear ThemeVistra Corp. (VST) – Cash Flow Machine
$4.09B TTM operating cash flow, highest among peers 2.
Strong nuclear and renewables mix, with AI data center exposure.
Thesis: Balanced growth and income play with upside from AI-driven demand.
Purchased CEG earlier. AI megatrend is tied to nuclear.
N
VST trendlinestill within the channel but broke below 9 sma, staying long as long as it stays within the channel, exit / short of it breaks the lower line.
NFA

See all ideas
Summarizing what the indicators are suggesting.
Neutral
SellBuy
Strong sellStrong buy
Strong sellSellNeutralBuyStrong buy
Neutral
SellBuy
Strong sellStrong buy
Strong sellSellNeutralBuyStrong buy
Neutral
SellBuy
Strong sellStrong buy
Strong sellSellNeutralBuyStrong buy
An aggregate view of professional's ratings.
Neutral
SellBuy
Strong sellStrong buy
Strong sellSellNeutralBuyStrong buy
Neutral
SellBuy
Strong sellStrong buy
Strong sellSellNeutralBuyStrong buy
Neutral
SellBuy
Strong sellStrong buy
Strong sellSellNeutralBuyStrong buy
Displays a symbol's price movements over previous years to identify recurring trends.
VSTE5789672
Vistra Operations Co. LLC 6.875% 15-APR-2032Yield to maturity
6.65%
Maturity date
Apr 15, 2032
VST5651497
Vistra Operations Co. LLC 7.75% 15-OCT-2031Yield to maturity
6.51%
Maturity date
Oct 15, 2031
VSTE5789663
Vistra Operations Co. LLC 6.0% 15-APR-2034Yield to maturity
6.03%
Maturity date
Apr 15, 2034
VST5789673
Vistra Operations Co. LLC 6.875% 15-APR-2032Yield to maturity
5.80%
Maturity date
Apr 15, 2032
VST4790088
Vistra Operations Co. LLC 5.625% 15-FEB-2027Yield to maturity
5.69%
Maturity date
Feb 15, 2027
USU9226VAW7
Vistra Operations Co. LLC 5.25% 15-OCT-2035Yield to maturity
5.46%
Maturity date
Oct 15, 2035
VST5944429
Vistra Operations Co. LLC 5.7% 30-DEC-2034Yield to maturity
5.36%
Maturity date
Dec 30, 2034
VST5789664
Vistra Operations Co. LLC 6.0% 15-APR-2034Yield to maturity
5.20%
Maturity date
Apr 15, 2034
VST4843716
Vistra Operations Co. LLC 5.0% 31-JUL-2027Yield to maturity
5.11%
Maturity date
Jul 31, 2027
VST5651428
Vistra Operations Co. LLC 6.95% 15-OCT-2033Yield to maturity
5.10%
Maturity date
Oct 15, 2033
17XA
Vistra Operations Co. LLC 4.375% 01-MAY-2029Yield to maturity
4.94%
Maturity date
May 1, 2029
See all 0V6 bonds
Frequently Asked Questions
The current price of 0V6 is 154.50 EUR — it has decreased by −7.14% in the past 24 hours. Watch Vistra Corp. stock price performance more closely on the chart.
Depending on the exchange, the stock ticker may vary. For instance, on FWB exchange Vistra Corp. stocks are traded under the ticker 0V6.
0V6 stock has fallen by −4.50% compared to the previous week, the month change is a −13.84% fall, over the last year Vistra Corp. has showed a 13.69% increase.
We've gathered analysts' opinions on Vistra Corp. future price: according to them, 0V6 price has a max estimate of 249.01 EUR and a min estimate of 175.52 EUR. Watch 0V6 chart and read a more detailed Vistra Corp. stock forecast: see what analysts think of Vistra Corp. and suggest that you do with its stocks.
0V6 stock is 0.97% volatile and has beta coefficient of 1.82. Track Vistra Corp. stock price on the chart and check out the list of the most volatile stocks — is Vistra Corp. there?
Today Vistra Corp. has the market capitalization of 52.42 B, it has decreased by −6.14% over the last week.
Yes, you can track Vistra Corp. financials in yearly and quarterly reports right on TradingView.
Vistra Corp. is going to release the next earnings report on Mar 4, 2026. Keep track of upcoming events with our Earnings Calendar.
0V6 earnings for the last quarter are 1.51 EUR per share, whereas the estimation was 1.77 EUR resulting in a −14.78% surprise. The estimated earnings for the next quarter are 1.96 EUR per share. See more details about Vistra Corp. earnings.
Vistra Corp. revenue for the last quarter amounts to 4.24 B EUR, despite the estimated figure of 5.21 B EUR. In the next quarter, revenue is expected to reach 4.66 B EUR.
0V6 net income for the last quarter is 555.63 M EUR, while the quarter before that showed 277.59 M EUR of net income which accounts for 100.16% change. Track more Vistra Corp. financial stats to get the full picture.
Yes, 0V6 dividends are paid quarterly. The last dividend per share was 0.19 EUR. As of today, Dividend Yield (TTM)% is 0.50%. Tracking Vistra Corp. dividends might help you take more informed decisions.
Vistra Corp. dividend yield was 0.63% in 2024, and payout ratio reached 12.48%. The year before the numbers were 2.13% and 22.92% correspondingly. See high-dividend stocks and find more opportunities for your portfolio.
As of Nov 13, 2025, the company has 6.85 K employees. See our rating of the largest employees — is Vistra Corp. on this list?
EBITDA measures a company's operating performance, its growth signifies an improvement in the efficiency of a company. Vistra Corp. EBITDA is 8.43 B EUR, and current EBITDA margin is 45.72%. See more stats in Vistra Corp. financial statements.
Like other stocks, 0V6 shares are traded on stock exchanges, e.g. Nasdaq, Nyse, Euronext, and the easiest way to buy them is through an online stock broker. To do this, you need to open an account and follow a broker's procedures, then start trading. You can trade Vistra Corp. stock right from TradingView charts — choose your broker and connect to your account.
Investing in stocks requires a comprehensive research: you should carefully study all the available data, e.g. company's financials, related news, and its technical analysis. So Vistra Corp. technincal analysis shows the sell today, and its 1 week rating is sell. Since market conditions are prone to changes, it's worth looking a bit further into the future — according to the 1 month rating Vistra Corp. stock shows the buy signal. See more of Vistra Corp. technicals for a more comprehensive analysis.
If you're still not sure, try looking for inspiration in our curated watchlists.
If you're still not sure, try looking for inspiration in our curated watchlists.