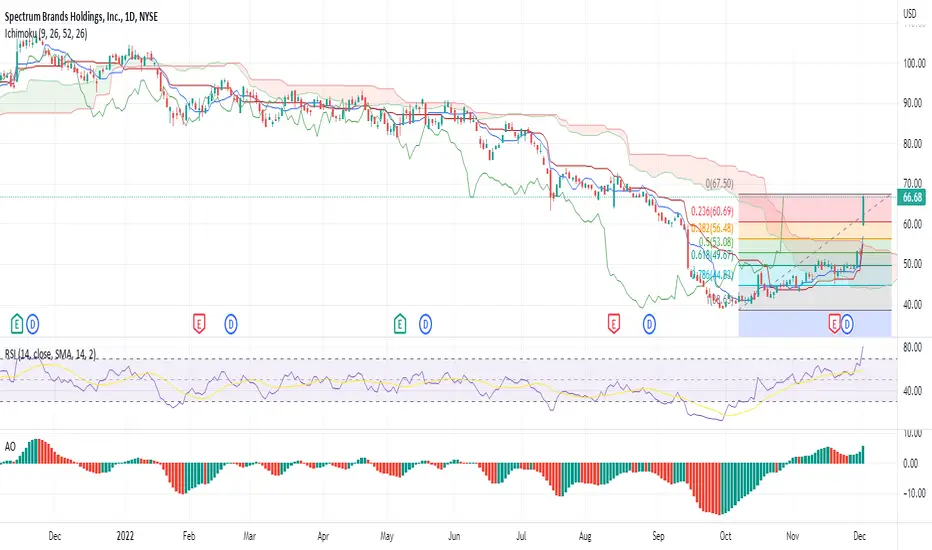
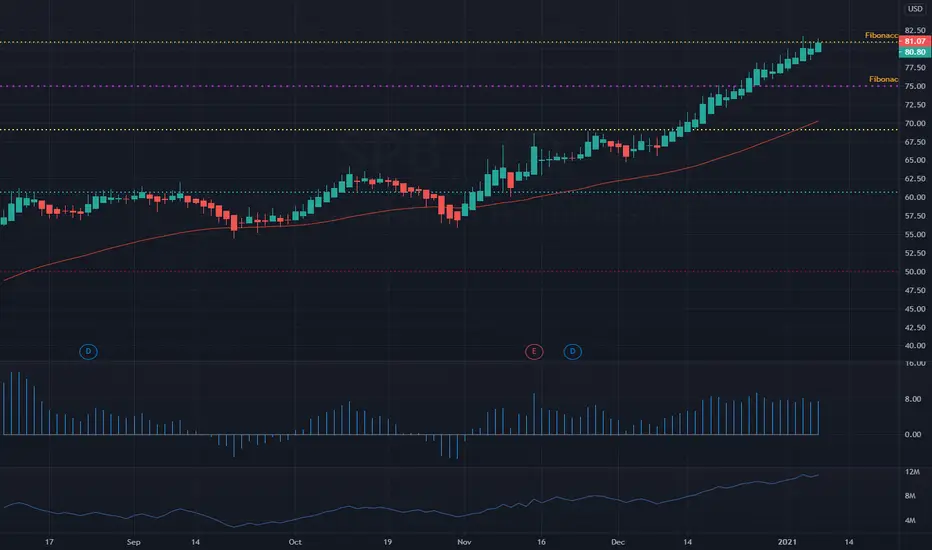
SPB - Vertical Similarities SPB has created formations that are very similar, they are in circles
Along the vertical lines I would call the middle of the structure.
We are at the point where price is looking to rise which I have shown with the bars pattern.
The strong uptrend is in green.
Next report date
—
Report period
—
EPS estimate
—
Revenue estimate
—
45.49EUR
1.71 BEUR
2.76 BEUR
29.29 M
About Spectrum Brands Holdings, Inc.
Sector
Industry
CEO
David M. Maura
Website
Headquarters
Middleton
Employees (FY)
3.1 K
Founded
1906
Spectrum Brands Holdings, Inc. engages in the manufacture and supply of consumer products and home essentials. The firm operates through the following segments: Home and Personal Care (HPC), Global Pet Care (GPC), and Home and Garden (H&G). The GPC segment focuses on the pet care business. The H&G segment is involved in the home and garden, cleaning products, and insect control business. The HPC segment includes the small kitchen and personal care appliances business. The company was founded in 1906 and is headquartered in Middleton, WI.

SPB Spectrum Brands Holdings Options Ahead of EarningsLooking at the SPB Spectrum Brands Holdings options chain ahead of earnings , I would buy the $70 strike price Calls with
2023-7-21 expiration date for about
$6.60 premium.
If the options turn out to be profitable Before the earnings release, I would sell at least 50%.
Looking forward to read your

SPB SELL+++++All the good little sheep are rushing in to defensive stocks because that's what they are told is safe. Bwahahhaaha bwahahahahha we cannot think for ourselves bwahahhahaha. We should easily fill this gap in coming days
$SPB Pulling back to Breakout SupportSimple pullback setup to breakout support on Spectrum.
Spectrum Brands Hldgs (SPB)- MANUFACTURES AND DISTRIBUTES OF CONSUMER BATTERIES, RESIDENTIAL LOCKSETS, BUILDING HARDWARE, PLUMBING

SPB (Spectrum Brands Holdings Inc.) - Bullish on quarterly moveSpectrum Brands Holdings
Spectrum Brands Holdings Inc. operates as a consumer products company. It supplies consumer batteries, residential lock sets, building hardware, plumbing, personal care products, household appliances, pet supplies, lawn and garden, home pest control equipment and auto care

Long | SPBNYSE:SPB
Possible Scenario: LONG
Evidence: Price Action
This is my idea and could be wrong100%
BUY to SPECTRUM BRANDS HOLDINGSHey people, SPECTRUM BRANDS HOLDINGS is in a fake bearish configuration with a strong sell volume at the start of the session then a weaker one at the end and a kind of water gate. The TIMEFRAME M1 on observed a tombstone with a low paid purchase volume heading to its latest low to make a turnaround


I believe SPB is a ShortI believe SPB is a Short. Maybe a week or two left going long but then short.

See all ideas
Trade directly on the supercharts through our supported, fully-verified and user-reviewed brokers.


Curated watchlists where H221 is featured.

Frequently Asked Questions
The current price of H221 is 88.50 EUR — it has increased by 1.14% in the past 24 hours. Watch SPECTRUM BRANDS HOLDINGS INC stock price performance more closely on the chart.
Depending on the exchange, the stock ticker may vary. For instance, on GETTEX exchange SPECTRUM BRANDS HOLDINGS INC stocks are traded under the ticker H221.
SPECTRUM BRANDS HOLDINGS INC is going to release the next earnings report on Aug 9, 2024. Keep track of upcoming events with our Earnings Calendar.
H221 stock is 1.14% volatile and has beta coefficient of 0.64. Track SPECTRUM BRANDS HOLDINGS INC stock price on the chart and check out the list of the most volatile stocks — is SPECTRUM BRANDS HOLDINGS INC there?
H221 earnings for the last quarter are 1.50 EUR per share, whereas the estimation was 0.63 EUR resulting in a 139.57% surprise. The estimated earnings for the next quarter are 1.04 EUR per share. See more details about SPECTRUM BRANDS HOLDINGS INC earnings.
SPECTRUM BRANDS HOLDINGS INC revenue for the last quarter amounts to 665.89 M EUR despite the estimated figure of 656.66 M EUR. In the next quarter revenue is expected to reach 700.36 M EUR.
Yes, you can track SPECTRUM BRANDS HOLDINGS INC financials in yearly and quarterly reports right on TradingView.
H221 stock has risen by 14.19% compared to the previous week, the month change is a 17.22% rise, over the last year SPECTRUM BRANDS HOLDINGS INC has showed a 36.15% increase.
H221 net income for the last quarter is 56.63 M EUR, while the quarter before that showed 17.03 M EUR of net income which accounts for 232.45% change. Track more SPECTRUM BRANDS HOLDINGS INC financial stats to get the full picture.
Today SPECTRUM BRANDS HOLDINGS INC has the market capitalization of 2.57 B, it has increased by 1.25% over the last week.
Yes, H221 dividends are paid quarterly. The last dividend per share was 0.39 EUR. As of today, Dividend Yield (TTM)% is 1.77%. Tracking SPECTRUM BRANDS HOLDINGS INC dividends might help you take more informed decisions.
SPECTRUM BRANDS HOLDINGS INC dividend yield was 2.14% in 2023, and payout ratio reached 3.68%. The year before the numbers were 4.30% and 91.13% correspondingly. See high-dividend stocks and find more opportunities for your portfolio.
Like other stocks, H221 shares are traded on stock exchanges, e.g. Nasdaq, Nyse, Euronext, and the easiest way to buy them is through an online stock broker. To do this, you need to open an account and follow a broker's procedures, then start trading. You can trade SPECTRUM BRANDS HOLDINGS INC stock right from TradingView charts — choose your broker and connect to your account.
H221 reached its all-time high on May 10, 2024 with the price of 89.50 EUR, and its all-time low was 44.02 EUR and was reached on Nov 18, 2022. View more price dynamics on H221 chart.
See other stocks reaching their highest and lowest prices.
See other stocks reaching their highest and lowest prices.
As of May 14, 2024, the company has 3.10 K employees. See our rating of the largest employees — is SPECTRUM BRANDS HOLDINGS INC on this list?
Investing in stocks requires a comprehensive research: you should carefully study all the available data, e.g. company's financials, related news, and its technical analysis. So SPECTRUM BRANDS HOLDINGS INC technincal analysis shows the buy rating today, and its 1 week rating is buy. Since market conditions are prone to changes, it's worth looking a bit further into the future — according to the 1 month rating SPECTRUM BRANDS HOLDINGS INC stock shows the strong buy signal. See more of SPECTRUM BRANDS HOLDINGS INC technicals for a more comprehensive analysis.
If you're still not sure, try looking for inspiration in our curated watchlists.
If you're still not sure, try looking for inspiration in our curated watchlists.
We've gathered analysts' opinions on SPECTRUM BRANDS HOLDINGS INC future price: according to them, H221 price has a max estimate of 106.66 EUR and a min estimate of 84.40 EUR. Watch H221 chart and read a more detailed SPECTRUM BRANDS HOLDINGS INC stock forecast: see what analysts think of SPECTRUM BRANDS HOLDINGS INC and suggest that you do with its stocks.
EBITDA measures a company's operating performance, its growth signifies an improvement in the efficiency of a company. SPECTRUM BRANDS HOLDINGS INC EBITDA is 215.76 M EUR, and current EBITDA margin is 4.39%. See more stats in SPECTRUM BRANDS HOLDINGS INC financial statements.