The GraphWe must wait some times. But who didnt sell before?
Buy time is here.
100% in coming weeks.
Can you see the trend?
GRTUSDT trade ideas

GRT Long Entry - Long swingGRT is a project I've been looking into and something that looks quite promising for the future.
As an entry point this looks like a good starting setup. Below the 200 and 100 SMA by a long way and resting on a hard standing support that's held so over a long time. Entering long here in the long term account.

grt / usdt 4h chart patterngrt / usdt 4h chart pattern
enter long after break falling wedge or after retest the descending trend line

GRT pumpRisk warning, disclaimer: the above is a personal market judgment based on published information and historical chart data on Tradingview, all analysis is only subjective. Hope investors consider, I am not responsible for your investment decision. Thank you.
Good luck

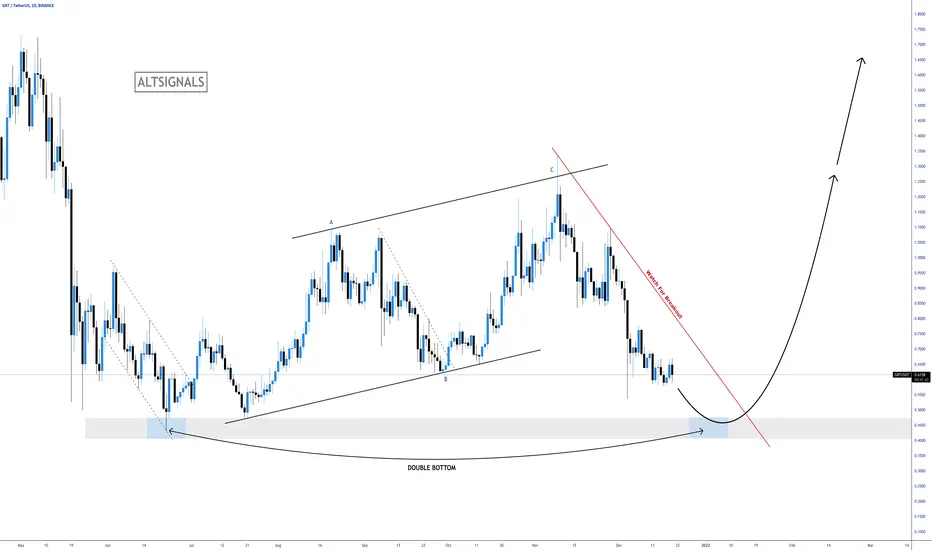
GRT - Double Bottoming! GRT is currently in a descending correction leading back to our previous bottom. In July we thought we were in an impulsive phase of the market where we were going to see the next big bullrun. However, instead we made an ABC correction for another move down. The best place to look for buys would be the double bottom area between 4-5.
Trade Idea:
- Watch for price to make one more move down
- Look for bullish price action at the 4-5 level
- Enter with stops below the lows
- Targets: 1.200 - 1.700 - ATH
Do you agree with this idea? Let us know below!


Long Hold on GRTLike a lot of altcoins, $GRT seems to be looking for a longer term bounce here, if RSI breaks white trendline upside should be confirmed and test those various fib levels. I think in the coming months GRT will definitely retest ATH. Short term, it all depends on how BTC behaves for now. We might experience a dip below triangle trendline (bear trap?) prior to price increase.

GRTUSDT, its going to complete Wave CGood evening guys
According to the chart you can see the price are in correction wave and we think we need more drop to touch to the prz level then the price is ready to go up and reach to the targets.
We will update the targets
As the price can suppport in first support area the best strategy for this situation is to buy in step by step to reduce average purchase
If you need any help, buy trading package and ... send us private message :D
Good Luck
Abtin

GRT floating on bottomIt's easy to pick a bottomed coin/token nowaday, basically most of them are but what isn't easy it's to pick the right project. I think GRT is one of the good one to hold for long as long as several L1s because it basically does something the cryptoverse needs.
Now, since BTC hasn't done a proper reversal yet I wouldn't reccomend you to go 100% in but at current level I think a 25-30% buy it's safe. After that you might keep an eye on this as it's clear that if weekly candle closes like this it'll make a lower low which is never a good thing. Notice that if history repeats itself we'll have a +100% in the next month and a half.
Good luck

GRT 12/12Late entry at 0.69
Much better would be at 0.677 after MARK UP TEST failed, meaning that there will be continuation of uptrend.
Another spike in volume followed by local accumulation in 0.69 zone on small volume indicate further move up.
TP at weekly resistance at 0.738
SL below VPVR at 0.666

GRT Coin Price Observes A Halt Near Support ZoneThe GRT coin price is currently seeing a bearish trend in the weekly technical chart. On coming to the daily chart the asset is in a consolidated trend. GRT upside trend may see a hostile region near $1. Meanwhile, the support of the coin sees a bounceback near $0.4. There is a strong consolidated supply zone formed in the GRT. If the asset price breaks down below the supply zone then a strong downside momentum can be seen. GRT/BTC pair can see similar gains in the future.

GRT good to shortThe price has consolidated below the support level and is ready to continue its downward movement

grt long trade idea 15 minute grt long trade idea 15 minute
risk to reward 1:3
full profit
decent support levels

GRTUsdtthsi coin with good fundamentl and have great chanse for pumping
rememebr i not clear old analyse for this fall not normal for GRt this ahppen for BTC fall for this i little change triangle but we can save that position and now good for buying
remember BTC again fall can on support lines buying but normal market i show you best entry point
need break Greent trend line on bottom triangle for massive move start again.
GL
EntryPoint :
0.6464
Supports:
0.5757
0.5154
0.5115
Resistances:
0.7759
0.8520
Targets:
0.9127
1.1202
1.5070
2.0292
for mid time and HODL:
3.0977
5.3050
7.0229
you can see higher targets forlong long time but this targets can happen if altseasone this cycle happen again
GL


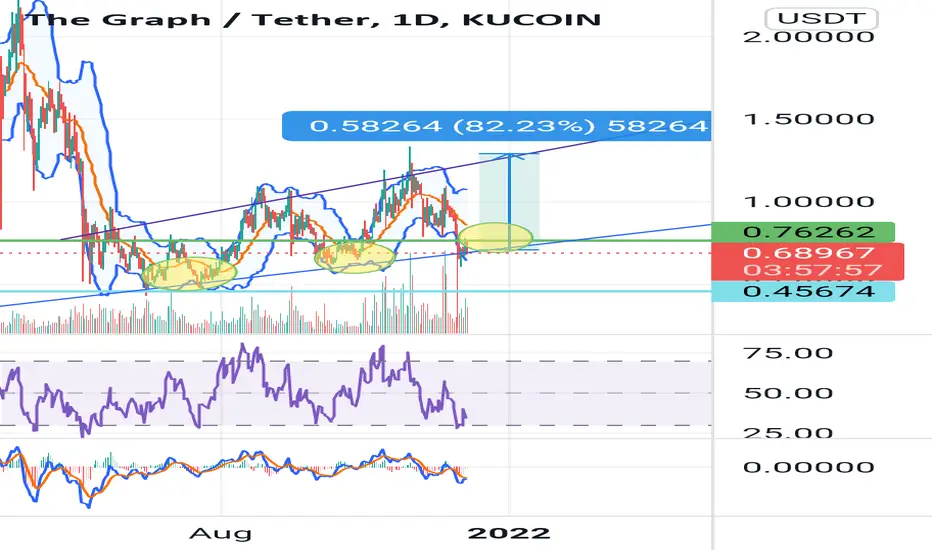
The GraphI think 82% up is coming
Everytime we have a down trend a double bottom appears (in yellow), and after that a new high.
According with this: in the next 5 days we will see the next touching support.
If that happens, time to buy.
GRTUSDT Technical Analysis💎 GRTUSDT has formed a symmetrical triangle. After the breaking above the major resistance and the triangle it is expected that the price will continue the bullish move
🌐 Tradingview
💵 Invest Only 5% of your Portfolio
🎳 Entry/Pullback now or from 0.7613 - 0.6994
☕️ TP1 0.8418
🍺 TP2 0.9399
🍻 TP3 1.0451
🍾 TP4 1.1530
🍷 TP5 1.2500
🍸 TP6
🍹 TP7
🎁 TP8
🚫 SL 0.6957 - 0.6359
Good Luck 🎲
Check the Links in Description and if you LIKE this analysis, please support our page and Ideas by hitting the LIKE 👍 button. ❤️ Your Support is really appreciated! ❤️
Traders, if you have your own opinion about it, please write your own in the comment box. We will be glad for this.
Feel free to request any pair/instrument analysis or ask any questions in the comment section below.
We will have more FREE forecasts in TradingView soon
Have a profitable day 😊👍🏻

The graph analysis (GRT)Hello guys, welcome back.
I think GRT is a great deal right now, price been accumulating for quite a long time, now I believe we should start going up again.
as you can see on chart, we also had this rounding bottom formation over and over, we have a very important resistance zone ( 1.05 - 1.1 $ ), break of this level can lead to a huge move.
Entry zone : 0.7 - 0.77$
Stop loss : 0.54$
Take profits :
1 ) 1.06 $
2 ) 1.26 $
3 ) 1.7 $
4) ATH
* It's not a financial advice *

GRT PERSONAL ANALYSIS IN THE LONG TERMChart shows common support and resistances based on price action and fibonacci. The total evaluation for GRT is neutral-bearish. The coin itself has a very promising application however the chart contradicts its supposed value. The Relative Strength Index shows bearish divergence per established oversold region and each of that does not establish any higher lows (higher highs are irrelevant without good higher lows). One should consider doing soft buys for the time being and not go all-in in this coin unless there's a good back-test of buyer interest (support) above the red zone to promote confidence in long term investment.

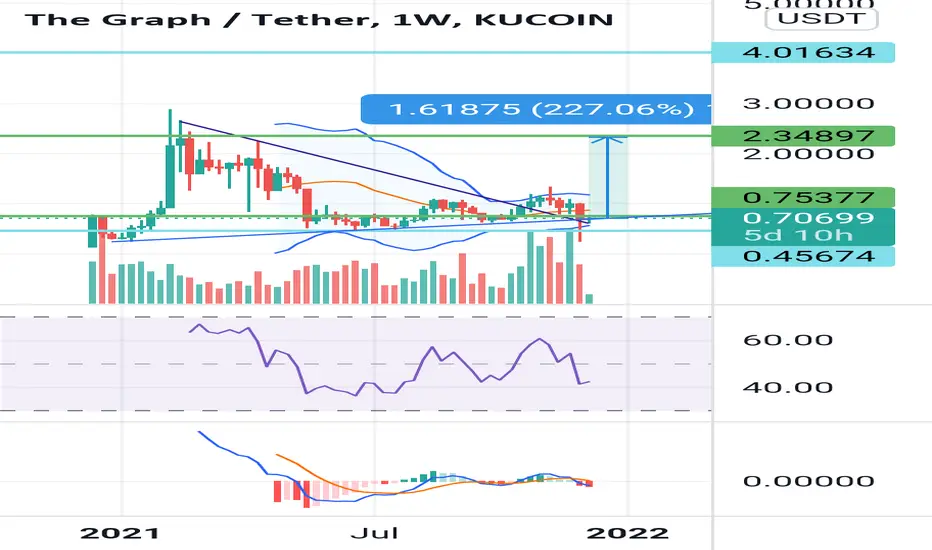
The GraphFor those who where waiting for The Graph, here a new analysis for The Week Chart. That is something we need some times and we forgot.
As you can see we are in the lowest area, an area when we touched it we Bounced back.
I think we can make a 300% but for sure this isn't gonna happen tomorrow. Remember this is Week-Chart
Dont forget the New Integration.
New integration.....
GRT Road to 2.85 & beyond Welcome to AHJ Chart Analysis
As last week we saw GRT-USDT drop over 31% and that is bearish for many but if we just zoom out we can see after breaking out it is very bullish for any coin to comeback and retest it as support.
We can see GRT-USDT held 0.236 fib and trendline beautifully. As market gets stable we might see GRT-USDT making its way to previous ATH.
