NVD trade ideas

Head and shoulders forming on NVDAThat's it,
We have a classic head and shoulders pattern forming on NVDA

$nvda update #Nvidia #NVDA update:
#Wallstreet back online after holidays with a familiar trend.
As major chipmaker stocks significantly outperformed the broader market.
Nvda stocks surged over 6% ->1.128, reaching New ATH.
( #ElonMusk xAI plans to build supercomputer fuel by #nvidea chips )
NVIDIA keeps on producing incredible results. We got ourselves another gap up to the next PPoint(1D). At this point we have adjust frames to continue analysis of the price movement but don't be surprised to see R5 touched, if R4 holds. Would like to see a double b bounce as with previous point for further confirmation.

$NVDA Jack in BoxSimple project where all lines from all rectangles are projected potential support and resistance. Looking to catch at least one reversal (in either direction) with a candlestick pattern or signal at any of them.
The vertical ones are more like time stamps for potential essential events like change in mood, sentiment, volatility or other.
The polygon is more like a zone where the probability of being penetrated is much lower than in other areas of the chart. This zone can provide a reversal too if it is accurate.
I will also be looking for potential consolidations inside the bigger rectangles which can lead to a breakout scenario from them, but I might be wrong on this envisioned scenario. Time will tell.
Will also try to cover with comments any relevant interesting Candlestick setups that catch my attention or interest.

Nvidia"Technical analysis suggests Nvidia may be forming a bull pennant pattern, potentially indicating future price movement within the range of $620-$1100."

⭐NVIDIA - 'Best Buy of the Decade?' (2 years later...) 👈🙄Best feature of Tradingview?
That everything stays, nothing can be amended or edited or deleted.
⏰ Jul 15, 2021:
⭐NVIDIA - Best Buy of the Decade? ⭐⭐⭐⭐ :
Some of the comments back then were:
❤️🩹Short it or you will regret it
❤️🩹It was a great buy few years ago. Key word, WAS.
❤️🩹holy f, have you done some valuation analysis? god tier company, the future of mankind. but stock=/=company, insanely overpriced
2 Years later everyone talks about NVIDIA as AI brings near a trillion-dollar valuation.
No further comment other than that i see Major resistance at 449-470$
One Love,
the FXPROFESSOR ⭐🙄

🔥🚀 **NVDA Update 27 May Gap Up Mania or Brief Correction! ** On Thursday, NVDA skyrocketed, smashing through the roof with a new high of 1063.13! By Friday, it closed above the last swing high at 1064.89, signalling a strong continuation of the bullish trend.
Investors are eagerly gearing up for a thrilling Tuesday, anticipating powerful moves ahead. Two exciting scenarios could unfold:
1️⃣ **Gap Up Mania!** 🌟 - With market sentiment glowing with positivity, we might see another gap up, potentially pushing the price to a staggering 1134, mirroring the previous exhilarating gap.
2️⃣ **Bullish Correction!** 📉➡️📈 - Alternatively, a brief correction to 1032 could set the stage for an even stronger uptrend.
The RRG analysis is buzzing with optimism, showing the XLK and SMH sectors in the leading quadrant.
Conclusion:
Get ready!! because NVDA is poised for an electrifying ride! 🌟📈💥

Triple top.. bye bye NvidiaPrice cannot get past 960-970$ zone
These failures create a triple top formation that is a very bearish pattern
I expect a sharp downtrend move in the next weeks

Can we go back to reality?Congratulations NVDA, because you delivered everything you could deliver in terms of good results, however, can we get back to reality?
Will the Black Monday that we experienced in 1987, in the DOW JONES index, be experienced again in 2024, and thanks to NVDA and technology companies?
We know what happened between 1980 and 1985 to the American economy, right?
It is known that in the 1980s and early 1990s, dollars could circulate freely around the world, so much so that we had a global economic miracle, and the world was swimming in booming growth.
But, at the current moment, dollars can no longer circulate freely around the world (FED, China, Russia) and continue contributing to global growth? Therefore, the technological war we are experiencing today (chips and electric cars), diverted dollars to these sectors, further inflating this bubble that is about to burst.
Speaking of electric cars, China is firmly dumping its electric cars around the world at very reasonable prices (as it has no intention of breaking its internal market – control), once and for all destroying the automobile industry in many emerging countries, oh my, no?
Let's go graphics.
Monthly: NVDA has reached the three golden levels of the FIB of the SETUP used, so there is nowhere else to go. So, SPX, get ready.
The red lines are resistance points.
Weekly: With the brilliant financial report recently released, prices are ready to seek the golden region of this chart period.
The red lines are resistance points.
Daily. Prices have reached the region of 100% of the bullish pivot.
The red lines are resistance points.
Do your analysis and good business.
Be aware, if you buy, use stop loss.
See other graphical analyzes below.

Long Term Bullish on NVDA: Target 1200$Hi, After my TSLA forecast which was confirmed when even everybody on the street was bearish.
I am back with NVDA, which is bullish in the long term. I am in a position for the NVDA 1010 Sept. Call. I trust Fortune 50 companies are investing, directly or indirectly, in LLM, which will lead to Cloud sales and intern drive NVDA card sales. The combined CAPEX purely in AI Graphic chipset buying alone would be upward of 2X-3X than any previous year of 2024.
Still, I don't have a crystal ball; hence, I will also secure my bet with cheap puts.
Please like and share If you like.

Nvidia vs Nasdaq1)Very smart move for 10:1 RS in Nvda imho this make it much easier to unload to retail cause psychologically $100 feels different than $1000 (look tesla top and RS)
I believe we are close to a blow off top target around $120 many similarities with Nasdaq 99-00 move
2)If i am not mistaken please do your reasearch a majority of Nvdia's factories are still in Taiwan vs Intel which has brought most of them back in the US
3)The saying is: where there is smoke there if fire and that could be the case with a Taiwan invasion some time in the long so distant future

Nvidia - Earnings, Channel, $1.000!Hello Traders and Investors, today I will take a look at Nvidia .
--------
Explanation of my video analysis:
If you are objectively looking at the stock chart of Nvidia, you can see that Nvidia is currently trading in a solid rising channel formation. But as we are speaking, Nvidia is retesting the upper resistance and considering that we just saw a rally of +700% without any real correction, it is quite likely that we will see at least a short term bearish rejection from here.
--------
Keep your long term vision,
Philip (BasicTrading)

$NVDA #Bullflag #Earnings #History PT;$1200 #DontShort Earnings questions? You've checked the right Idea.
"When in doubt, zoom out."
Color Coated a lot of these crayon lines for you bois. LOG SCALE
Arrows on last earnings and upcoming earnings... I've only seen more and more AI growth/hype... Shorting this is like shorting EV's in 2020 #NotTheTime...
"NVDA 1150 by May" ;) - Prof
Everything is "lining" up here imo...
I'm happy to see people wanting to short this personally, adds to the #Squeeze.
#WhiteBoySummer gets started Wednesday 5/22
NVDA 1000C 6/21/2024 @ $35.20
Not financial advice.

$NVDA Risk On into Earnings Post Market 5/22/24Seeing lots of double/triple tops on multiple timeframes. Way overbought but that's never an entry thesis. Just love the contrarian risk reward to the downside here with a hard stop at $975. Quick trade one way or the other and my love for NVDA does not constitute a trade per rules.

$NVDA Implied move for Earning today in After hoursNASDAQ:NVDA Implied move for Earning today in After hours
The implied move for NVDA earnings today is +/-80… place your bets

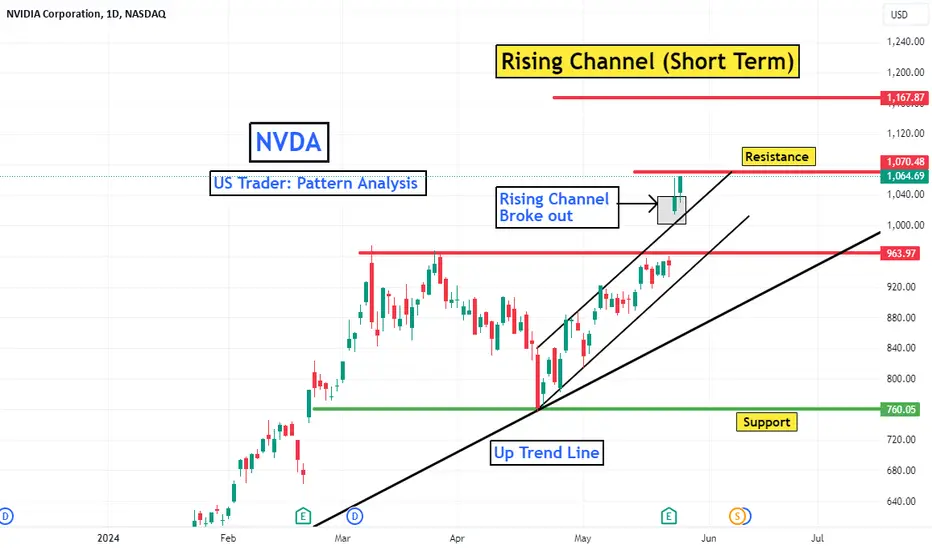
NVDA: Rising Channel (Short Term)Key Points: NASDAQ:NVDA
1. A raising channel shows a clearly defined uptrend. It is generally considered a bullish continuation pattern.
2. A breakout above an ascending channel can signal a continuation of the move higher.
3. A breakdown below an ascending channel can indicate a possible trend change.
Notice :
looking for a job
------------------------
Is Your company hiring an assistant day & swing Trader/ assistant technical analyst/ assistant equity analyst?
I am a day & swing trader, freelancer technical analyst & equity analyst. Now, I am looking for a job .
Skills: Chart analysis, Trend identification, Price pattern recognition, important support and resistance levels identification,
Set up trade idea ( long /short),
Set up entry and target price.
Valuation, making analysis report etc...
Experience: 5 years.
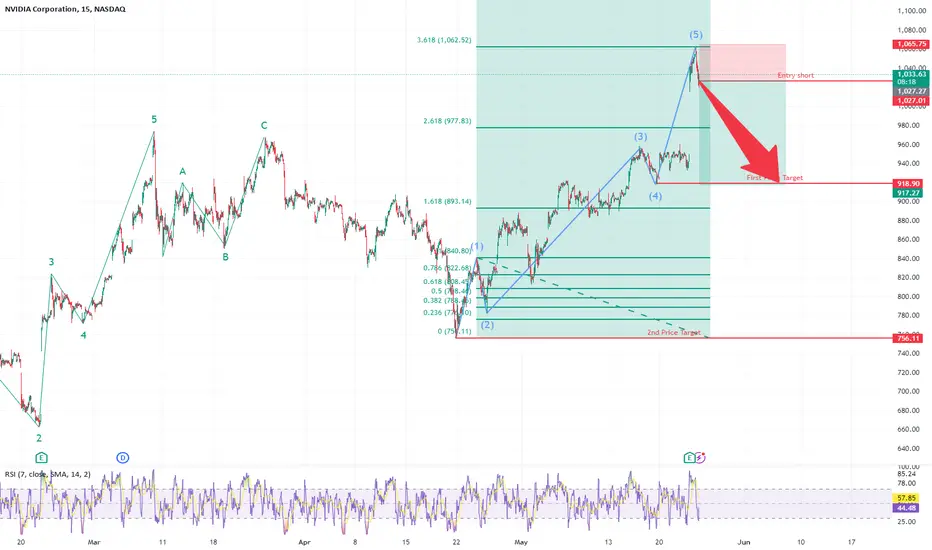
NVDA short: Hit Price Target from Fibonacci extensionI had previously mentioned to wait to short NVDA with resistance around $970 and expected their earnings to push the stock to gap up to just below $1000 (I had expected around $991). But good thing is that it gapped up way above the 2 prices mentioned above and actually made a perfect top at the Fibonacci extension level. Meaning if people had waited according to what I said, they could enter the short position at a much more favourable price.
NVIDIA Technical AnalysisBased on Fibonacci levels, I would not buy NVIDIA at the current price. I believe those who purchased NVIDIA at much lower levels will start to sell around these points, as it appears overvalued with a PE ratio of 88, which is quite high. By only using Fibonacci levels and ignoring the hype of AI, earnings, and news, I could be wrong, but I think the price will decline in the coming months, and we are currently at a top.
Please note, I am not a professional trader, I am just learning.

$NVDA All Systems Go. 1000C Lottos 5/17 JUICE IS WORTH SQUEEZE!1024 Target for Lotto Contracts.
10x 1000C @ $0.60 per
Been a Lucky Week.
(I don't believe in luck)
- Prof
GL HF
Not Financial Advice ;)

NVDA earnings stats NVDA earnings stats based on the last 10 earnings days close to following day close.
11/17/21
293 - 317
+ 24 = + 8%
2/16/22
265 - 245
- 20 = - 9%
5/25/22
170 - 179
+ 9 = + 5%
8/24/22
172 - 179
+ 7 = + 4%
11/16/22
159 - 157
- 2 = - 1%
2/22/23
208 - 237
+ 29 = + 14%
5/24/23
305 - 380
+ 75 = + 25%
8/23/23
471 - 472
+ 1 = na %
11/21/23
499 - 487
- 12 = - 2%
2/21/24
675 - 785
+ 110 = + 16%
5/22/24 ?
10 earnings
average = + 6%
high = + 25%
low = - 9%
5/24/24 expiry options data:
Put Volume Total 144,889
Call Volume Total 221,403
Put/Call Volume Ratio 0.65
Put Open Interest Total 145,386
Call Open Interest Total 180,269
Put/Call Open Interest Ratio 0.81
Highest OI Call strike = 950
Highest OI Put strike = 920
IV implied move = +/- 9%

Nvida Back on Track to Reach 1,157My 03/12/24 post illustrated that NVDA could reach 1157. Subsequently NVDA broke important support noted in 04/19/24 post.
The NVDA 05/22/24 earnings report has put the stock back on track to hit what could be major resistance near 1,157.

NVDA waves from its first day.Hello
The main difference between Elliott and the other techniques is to draw a complete map from the start through the future of the market and none of other methods can do that.
If this counting is correct or not wont change this rule and whenever our markings is incorrect we just need to repaint instead of changing our methods.
For now this what I have labelled for NVDA and it might change in the next week.
Red cycle counting is an alternative and red level is its invalidation area.
Just Keep your Balance safe

NVDA: Rising Wedge Pattern/ Date: 26.05.24Key Points:
1. A raising wedge pattern is used to identify possible trend reversals.
2. It is considered a bearish pattern.
3. It signals that the buying momentum is slowing down.
4. 1070 - may act as a resistance.
5. 964 - may act as a support
Notice :
looking for a job
------------------------
Is Your company hiring an assistant day & swing Trader/ assistant technical analyst/ assistant equity analyst?
I am a day & swing trader, freelancer technical analyst & equity analyst. Now, I am looking for a job .
Skills: Chart analysis, Trend identification, Price pattern recognition, important support and resistance levels identification,
Set up trade idea ( long /short),
Set up entry and target price.
Valuation, making analysis report etc...
Experience: 5 years.
