HCA Healthcare I observe a clear rotation of capital into the healthcare sector, with strong inflows toward medical companies reporting solid earnings and outlooks. Within this rotation, HCA Healthcare appears to be the most attractively valued company, supported by consistent profitability, a strong balance sheet
Next report date
—
Report period
—
EPS estimate
—
Revenue estimate
—
28.71 USD
6.78 B USD
75.60 B USD
153.20 M
About HCA Healthcare, Inc.
Sector
Industry
CEO
Samuel N. Hazen
Website
Headquarters
Nashville
Founded
1968
IPO date
Mar 9, 2011
Identifiers
3
ISIN US40412C1018
HCA Healthcare, Inc. is a health care services company engaged in operating hospitals, freestanding surgery centers and emergency care facilities, urgent care facilities, walk-in clinics, diagnostic and imaging centers, radiation and oncology therapy centers, comprehensive rehabilitation and physical therapy centers, physician practices, home health, hospice, outpatient physical therapy home and community-based services providers, and various other facilities. The firm operates general and acute care hospitals that offer medical and surgical services, including inpatient care, intensive care, cardiac care, diagnostic, and emergency services, and outpatient services, such as outpatient surgery, laboratory, radiology, respiratory therapy, cardiology, and physical therapy. The company was founded by Dr. Thomas F. Frist, Jr in 1968 and is headquartered in Nashville, TN.
Related stocks

HCA - Precision Swing Long (Consistent Technical Alignment)🎯 Ticker: HCA (NYSE)
📈 Type: Swing Long
⏰ Timeframe: Daily (D1) & 4H
📊 Multi-Timeframe Technical Analysis:
Daily Trend: BULLISH ✅
Technical Alignment: BUY Signals Across All Timeframes (Daily, 4H, 1H)
Key Support: $450-455 zone (Confluence of SMA 20 & previous resistance)
Momentum: RSI (57.6) sh

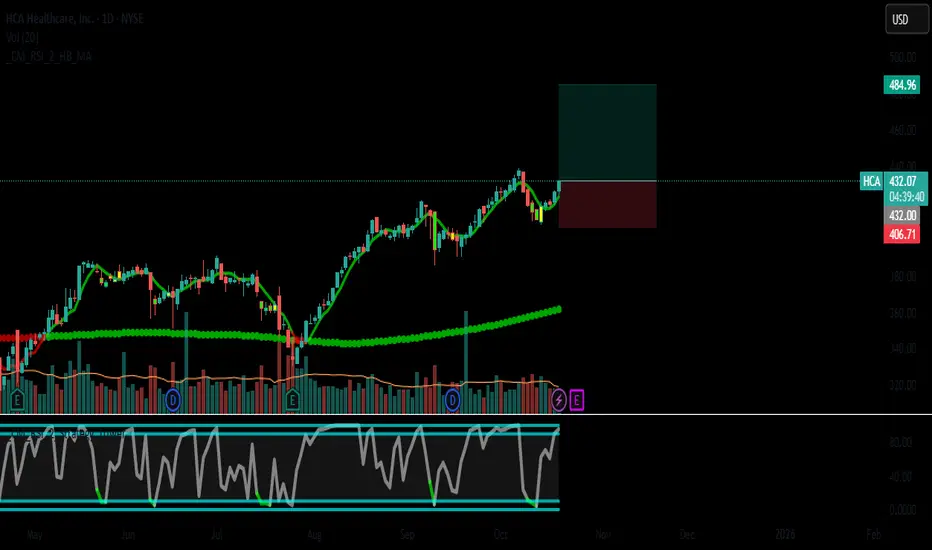
HCA - High-Probability Swing Trade with Connors ConfirmationHCA - HCA Healthcare, Inc.
🏥 Strong Buy Signal | Confirmed by Fundamentals, Technicals & Connors RSI2
🎯 Trade Idea Overview
Direction: LONG
Entry Zone: $429 - $433
Stop Loss: $406.70
Take Profit: $484.96
Strategy: Swing to Position Trade (2–6 weeks)
Confidence Level: High (85%)
📊 Why HCA?
✅ F
HCA Healthcare | HCA | Long at $299.00NYSE:HCA Healthcare: P/E of 13x, earnings are forecast to grow 6.01% per year; earnings have grown 10.6% per year over the past 5 years, and trading at good value compared to peers and industry.
From a technical analysis perspective, it dipped to my selected historical simple moving average area a

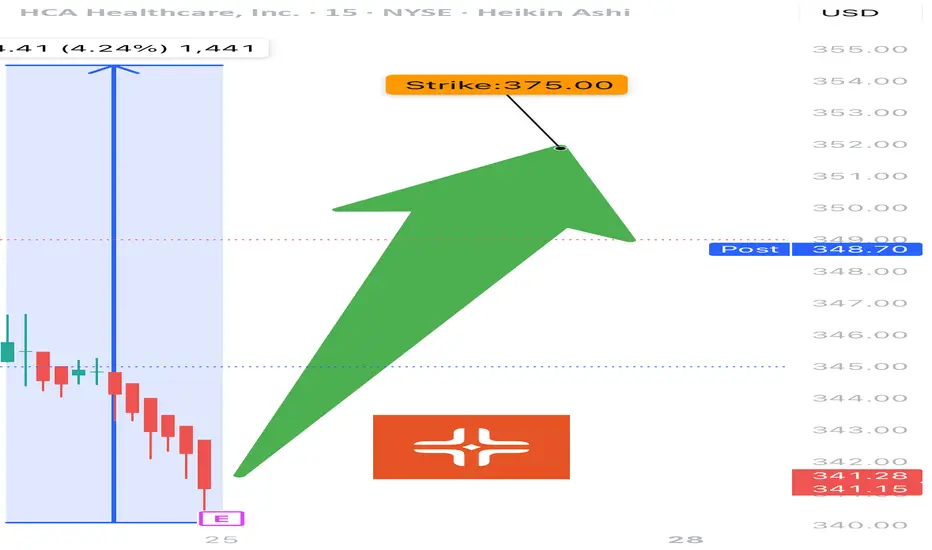
HCA EARNINGS TRADE (07/24)
🚨 HCA EARNINGS TRADE (07/24) 🚨
🏥 Healthcare with earnings tonight after close — high-upside setup brewing.
🧠 Quick Breakdown:
• 📊 Revenue Growth: +5.7% (stable, defensive sector)
• 💸 Margins: Operating 15.6%, EBITDA 19.9% = efficient and strong
• 🧠 Beat Rate: 75% with 6.7% avg surprise → credible
HCA exhibits strong financial health!Technical Analysis
HCA's stock has demonstrated resilience, with a 52-week range between $276.50 and $417.14. The Relative Strength Index (RSI) stands at 58.01, suggesting the stock is neither overbought nor oversold. The Moving Average Convergence Divergence (MACD) is 0.11, indicating a potential

HCA Advances as Tech StumblesHealthcare is the leading sector so far this year, and some traders may see opportunity in hospital operator HCA Healthcare.
Today’s weekly chart considers the all-time high above $410 in October, followed by a substantial pullback. Prices stabilized early this year around $290 (near the low from l

Head & ShouldersThis pattern consists of 2 shoulders that should be in the same ballpark in price but are rarely the exact same price.
The 2 shoulders should be close to the same distance from the head which is a high point between the 2 shoulders.
T1 has just about been met. Sometimes t1 is all we get.
Earnings

HCA - head & ShouldersThis is usually a market leader! When market leaders trigger bearish patterns, you need to be cautious.
Not an all out short but with bearish consolidation under the neckline it's worth taking a stab.
As long as rejection occurs at the neckline this could see like downside.

$HCA with a bullish outlook following its earnings #StocksThe PEAD projected a bullish outlook for NYSE:HCA after a negative over reaction following its earnings release placing the stock in drift C with an expected accuracy of 55.56%.

See all ideas
Summarizing what the indicators are suggesting.
Neutral
SellBuy
Strong sellStrong buy
Strong sellSellNeutralBuyStrong buy
Neutral
SellBuy
Strong sellStrong buy
Strong sellSellNeutralBuyStrong buy
Neutral
SellBuy
Strong sellStrong buy
Strong sellSellNeutralBuyStrong buy
An aggregate view of professional's ratings.
Neutral
SellBuy
Strong sellStrong buy
Strong sellSellNeutralBuyStrong buy
Neutral
SellBuy
Strong sellStrong buy
Strong sellSellNeutralBuyStrong buy
Neutral
SellBuy
Strong sellStrong buy
Strong sellSellNeutralBuyStrong buy
Displays a symbol's price movements over previous years to identify recurring trends.
HCA.GF
Columbia/HCA Healthcare Corp. 7.5% 15-NOV-2095Yield to maturity
6.76%
Maturity date
Nov 15, 2095
HCA5372914
HCA Inc. 4.375% 15-MAR-2042Yield to maturity
6.21%
Maturity date
Mar 15, 2042
HCA5372916
HCA Inc. 4.625% 15-MAR-2052Yield to maturity
6.15%
Maturity date
Mar 15, 2052
HCA5757225
HCA Inc. 6.1% 01-APR-2064Yield to maturity
6.07%
Maturity date
Apr 1, 2064
HCA6009047
HCA Inc. 6.2% 01-MAR-2055Yield to maturity
5.95%
Maturity date
Mar 1, 2055
HCA5757224
HCA Inc. 6.0% 01-APR-2054Yield to maturity
5.95%
Maturity date
Apr 1, 2054
HCA5581318
HCA Inc. 5.9% 01-JUN-2053Yield to maturity
5.95%
Maturity date
Jun 1, 2053
HCA5868805
HCA Inc. 5.95% 15-SEP-2054Yield to maturity
5.94%
Maturity date
Sep 15, 2054
HCA5604246
HCA Inc. 4.625% 15-MAR-2052Yield to maturity
5.91%
Maturity date
Mar 15, 2052
HCA4843309
HCA Inc. 5.25% 15-JUN-2049Yield to maturity
5.90%
Maturity date
Jun 15, 2049
HCA6217610
HCA Inc. 5.7% 15-NOV-2055Yield to maturity
5.89%
Maturity date
Nov 15, 2055
See all HCA bonds
Frequently Asked Questions
The current price of HCA is 540.29 USD — it has increased by 0.71% in the past 24 hours. Watch HCA Healthcare, Inc. stock price performance more closely on the chart.
Depending on the exchange, the stock ticker may vary. For instance, on NYSE exchange HCA Healthcare, Inc. stocks are traded under the ticker HCA.
HCA stock has risen by 8.13% compared to the previous week, the month change is a 12.68% rise, over the last year HCA Healthcare, Inc. has showed a 71.80% increase.
We've gathered analysts' opinions on HCA Healthcare, Inc. future price: according to them, HCA price has a max estimate of 598.00 USD and a min estimate of 425.00 USD. Watch HCA chart and read a more detailed HCA Healthcare, Inc. stock forecast: see what analysts think of HCA Healthcare, Inc. and suggest that you do with its stocks.
HCA stock is 2.69% volatile and has beta coefficient of 0.28. Track HCA Healthcare, Inc. stock price on the chart and check out the list of the most volatile stocks — is HCA Healthcare, Inc. there?
Today HCA Healthcare, Inc. has the market capitalization of 119.69 B, it has decreased by −0.33% over the last week.
Yes, you can track HCA Healthcare, Inc. financials in yearly and quarterly reports right on TradingView.
HCA Healthcare, Inc. is going to release the next earnings report on Apr 24, 2026. Keep track of upcoming events with our Earnings Calendar.
HCA earnings for the last quarter are 8.01 USD per share, whereas the estimation was 7.46 USD resulting in a 7.39% surprise. The estimated earnings for the next quarter are 7.17 USD per share. See more details about HCA Healthcare, Inc. earnings.
HCA Healthcare, Inc. revenue for the last quarter amounts to 19.51 B USD, despite the estimated figure of 19.68 B USD. In the next quarter, revenue is expected to reach 19.09 B USD.
HCA net income for the last quarter is 1.88 B USD, while the quarter before that showed 1.64 B USD of net income which accounts for 14.30% change. Track more HCA Healthcare, Inc. financial stats to get the full picture.
Yes, HCA dividends are paid quarterly. The last dividend per share was 0.72 USD. As of today, Dividend Yield (TTM)% is 0.54%. Tracking HCA Healthcare, Inc. dividends might help you take more informed decisions.
HCA Healthcare, Inc. dividend yield was 0.62% in 2025, and payout ratio reached 10.17%. The year before the numbers were 0.88% and 12.00% correspondingly. See high-dividend stocks and find more opportunities for your portfolio.
As of Feb 14, 2026, the company has 320 K employees. See our rating of the largest employees — is HCA Healthcare, Inc. on this list?
EBITDA measures a company's operating performance, its growth signifies an improvement in the efficiency of a company. HCA Healthcare, Inc. EBITDA is 15.49 B USD, and current EBITDA margin is 20.49%. See more stats in HCA Healthcare, Inc. financial statements.
Like other stocks, HCA shares are traded on stock exchanges, e.g. Nasdaq, Nyse, Euronext, and the easiest way to buy them is through an online stock broker. To do this, you need to open an account and follow a broker's procedures, then start trading. You can trade HCA Healthcare, Inc. stock right from TradingView charts — choose your broker and connect to your account.
Investing in stocks requires a comprehensive research: you should carefully study all the available data, e.g. company's financials, related news, and its technical analysis. So HCA Healthcare, Inc. technincal analysis shows the buy rating today, and its 1 week rating is strong buy. Since market conditions are prone to changes, it's worth looking a bit further into the future — according to the 1 month rating HCA Healthcare, Inc. stock shows the strong buy signal. See more of HCA Healthcare, Inc. technicals for a more comprehensive analysis.
If you're still not sure, try looking for inspiration in our curated watchlists.
If you're still not sure, try looking for inspiration in our curated watchlists.