Bitcoin is heading towards the moon
To the best of my understanding, I think
BTC is completing the fifth wave of the third wave of a five-wave rally (Wave 3 is still not complete).
MACD: Buy signal
HEDGEUSD trade ideas

Bitcoin Monthly Chart Analysis!!Hello friends.
Bitcoin (BTC) has broken its previous all-time high and successfully retested it.
The monthly candle closed at $67,548, indicating strong bullish momentum.
Previous All-Time High: BTC breaking and retesting this level indicates strong support and a potential base for further gains.
Monthly Close: The monthly close at $67,548 indicates continued buying interest and bullish sentiment in the market.
Support Level: The previous all-time high now acts as a strong support level, providing a solid base for BTC’s upward move.
Resistance Level: The next significant resistance levels could be around $72,000, $74,000, and $76,000.
Bullish Scenario: Continued upward movement could see BTC testing and potentially breaking the next resistance levels.
Continued bullishness could lead to new all-time highs being reached due to strong market sentiment and institutional interest.
BTC may consolidate around current levels, gaining strength before the next significant move. Consolidation phases are common after substantial bullish momentum, causing the market to stabilize.
If BTC fails to maintain its current levels, we could see a pullback to retest support around the previous all-time high. Failure to hold this support could signal a deeper correction, although this is unlikely given the current bullish momentum.
The current levels provide a favorable entry point for long positions, with significant upside potential.
Apply stop-loss orders below key support levels to mitigate potential downside risks.
BTC’s successful retest of the previous all-time high and strong monthly close at $67,548 indicates a bullish trend. We are optimistic about BTC’s ability to continue its upward trajectory and reach new highs. Stay tuned for further updates and analysis! 🚀
What are your thoughts on this chart? Feel free to share your thoughts in the comments section. Thanks!

Bitcoin: lost upside momentum?The story about the first ETH ETF continues to shape the crypto market sentiment for the second week in a row. SEC made its initial approval, but the question still stands when they will approve the first ETF to be officially listed. In this sense, the market took a moment to reflect on this information, so the BTC trading was a bit left behind the spectrum of investors. The BTC price was moving in a relatively short range during the week, between levels of $70.489 and $66.902. The $70K resistance has been tested for one more time, but again, without a market strength to finally break it.
The RSI is moving away from the overbought market side, currently osculating above the level of 50. However, without a clear push of the price toward the upside, it could be expected that the indicator will slowly start its path toward the oversold market side. Moving average of 50 days is moving as a parallel line with its MA200 counterpart. There is still no space for a potential cross in a short period of time.
The charts are still mixed a bit. It is interesting that from the mid-March this year, the market could not find a strength to sustain prices above the $70K level. Sort of market exhaustion is evident on the BTC market, in which sense, some reversal might be possible in the coming period. This is not necessarily a bad thing, as a prop in price will increase its volatility and buy-the-dip buyers will for one more time push the price of the BTC to the higher grounds. At this point on short term charts, it is unclear where this price might stand. Looking at the higher frame, the level of $ 65K is marked, however, the support line at $60K stands as the end of the cycle. For the week ahead, there is lower probability for a $ 65K support line, but also low probability that $70K resistance could be breached.

BITCOIN - TIME TO BUY?$2.5 Billion In Bitcoin Withdrawn From Centralized Exchanges – A Bullish Signal?
Investor confidence in the crypto market is rising, and Bitcoin is reaping the benefits. Large-scale investors are accumulating BTC despite its recent price fluctuations.
In May, Bitcoin's price failed to stay above the critical $70,000 mark, even though it briefly touched this level twice in the last two weeks. However, recent on-chain data shows growing faith in Bitcoin.
Is BTC Ready for a Price Rally?
Prominent crypto analyst Ali Martinez highlighted a significant outflow of Bitcoin from centralized exchanges in a recent post on the X platform. This observation is based on the CryptoQuant Exchange Reserve metric, which tracks the amount of a specific cryptocurrency held in centralized exchange wallets.
An increase in this metric indicates more deposits than withdrawals of Bitcoin into exchanges, whereas a decrease implies more withdrawals than deposits.
Martinez reported that over 37,000 BTC, worth approximately $2.53 billion, have been withdrawn from exchanges in the past three days. This significant outflow signals a shift in sentiment and suggests that investors are increasingly opting to hold Bitcoin in self-custodial wallets for the long term.
While the exact reasons for this massive outflow are unclear, the movement of funds away from exchanges points to increased investor confidence in Bitcoin's future. This shift could lead to a supply crunch, a situation where demand exceeds supply, potentially driving up Bitcoin's price.
Bitcoin Price Overview
As of now, Bitcoin is priced around $67,489, showing a 1.5% decline in the past 24 hours. Despite this, the ongoing reduction of BTC on exchanges might set the stage for a bullish rally, especially if the supply crunch materializes.

Short BTC Setup Based on Structure Break and Quasimodo Pattern Short BTC Setup Based on Structure Break and Quasimodo Pattern (1-Hour Time Frame)
Here's a potential short setup for Bitcoin (BTC) using a structure break on the 1-hour time frame and the Quasimodo (QM) pattern, illustrated by the chart:
Structure Break Analysis:Current Price: BTC is trading around $68,159.
Key Levels:
PDH (Previous Day High): $69,526.65
D-open (Day Open): $68,400
PDL (Previous Day Low): $67,159.03
Quasimodo (QM) Pattern:
Higher High (HH): BTC reached a peak at $69,600.
Higher Low (HL): A trough formed around $68,000.
Lower High (LH): BTC formed a lower high at $68,400 (near the day open).
Lower Low (LL): The potential lower low could be around $67,000 (near PDL).
Entry and Execution:
Entry Point: Short at the retest of the D-open level ($68,400) after the structure break.
Stop Loss: Place above the recent lower high, around $68,500.
Take Profit: Target the PDL level at $67,159 or adjust based on a favorable risk-reward ratio.
Chart Analysis:
The chart shows BTC breaking below the D-open level, indicating a potential bearish trend continuation.
The Quasimodo pattern suggests a bearish reversal, with BTC forming a lower high and breaking below the higher low.
By following this setup, traders can potentially capitalize on the bearish momentum in BTC. Remember to use proper risk management strategies to protect your capital.

BTCUSD The Target Is UP! BUY!
My dear subscribers,
My technical analysis for BTCUSD is below:
The price is coiling around a solid key level - 67651.
Bias - Bullish
Technical Indicators: Pivot Points Low anticipates a potential price reversal.
Super trend shows a clear buy, giving a perfect indicators' convergence.
Goal - 69199
My Stop Loss - 66702
About Used Indicators:
By the very nature of the supertrend indicator, it offers firm support and resistance levels for traders to enter and exit trades. Additionally, it also provides signals for setting stop losses
———————————
WISH YOU ALL LUCK

Double Top/Double Bottom/Triangle Duplicate idea 3 to show smart money movements. Double top downtrend rejection but later made its move to a fall creating a double bottom. Short position belong to hidden double top.
Smart money green and red trendlines; all I did was retrace and applied to chart which are areas where smart money revisits.
Reads triangle, hoping for a breakout which consists with double bottom.
FYI: since double top is complete; trend may go sideways or make its way up. Hidden double tops have gone down as low as 2.29%. Target is at 2%.

BRIEFING Week #22 : Rotation Signaling is HereHere's your weekly update ! Brought to you each weekend with years of track-record history..
Don't forget to hit the like/follow button if you feel like this post deserves it ;)
That's the best way to support me and help pushing this content to other users.
Kindly,
Phil


The latest analysis and advice, hope to help you!Hello traders, I want share with you my opinion about Bitcoin. Observing the chart, we can see that the price some time ago entered to upward wedge, where it at once rebounded from the support line and rose to the support level, which coincided with the buyer zone and broke it. After this BTC some time traded near the 66700 level and then fell to the buyer zone, after which made a strong upward impulse to the resistance line of the wedge, breaking the resistance level, which coincided with the seller zone. But the price soon turned around and in a short time declined to the support level, thereby breaking the 70400 level one more time, after which it started to grow and later reached the resistance level again. Then Bitcoin rebounded from this level and made a correction movement to the support level again, but a not long time ago price bounced from this level and started to grow. At the moment, I think that BTC can correct the support line and then rebound to the resistance line of the wedge pattern. For this reason, I set my target at 69400 points, which coincided with the resistance line.

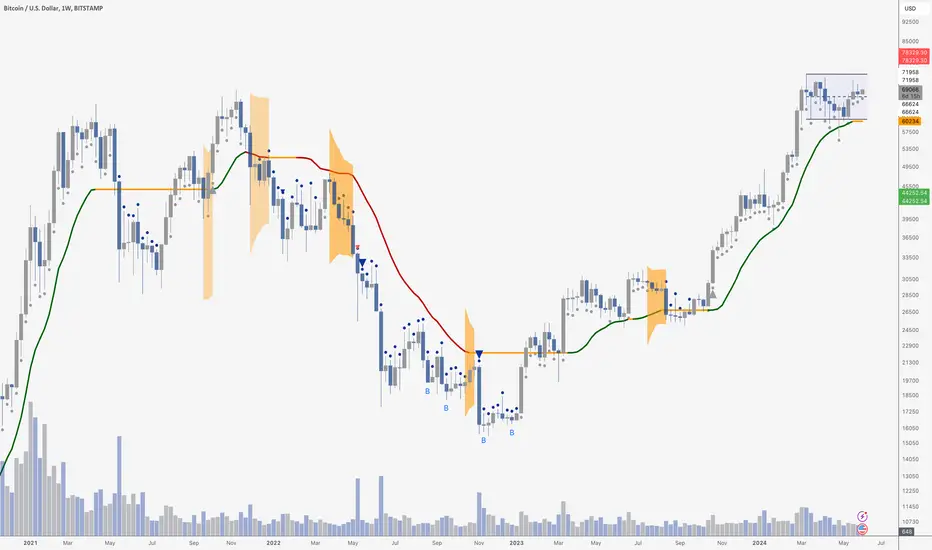
BTC LOOKS STRONGIt is essential to occasionally zoom out.
Taking a look at the weekly chart gives us an astounding picture of Bitcoin’s move. This consolidation looks like almost nothing after this run up from $15,000 - just the expected chop after the halving.
As you can see, we are trading in the top half of the blue range, which means we should eventually visit the range highs. A break above send us back into price discovery,
Be patient - everything still look exceptionally strong.
BTC fluctuates upward in the short termYesterday, Bitcoin broke through the downward trend line, and then broke through the resistance levels of 68400 and 69000, entering a rapid rise phase. In the short term, it is likely to maintain a fluctuating upward trend. The main trading idea is to buy when the price falls back to the lower resistance range. At present, you can focus on the resistance range of 68800-69250.
Trading suggestion: If the price falls back to the range of 68800-69250, you can buy, with a target of 70000-70500
The above transactions are for reference only, and I will update the market analysis in my guidance group at any time

June 3 Bitcoin Bybit chart analysisHello
It's a Bitcoinguide.
If you have a "follower"
You can receive comment notifications on real-time travel routes and major sections.
If my analysis is helpful,
Please would like one booster button at the bottom.
Bitcoin 30-minute chart.
There will be an announcement of Nasdaq indicators in a moment at 11 o'clock.
Rising wave on NASDAQ, Tether dominance vertical decline condition
I created today's strategy.
$67676.5 purple finger at the bottom left
I connected the long entry section on May 31st to today's strategy.
*Red finger movement path
One-way long position strategy
1. $68715.5 long position entry zone / stop loss when breaking out of the green support line
2. $70487.5 long position 1st target -> Top 2nd target -> Good 3rd target
It is a rebound from the 12+ daily candle where the pattern was restored.
In terms of overall signals, 12-hour, daily, and weekly MACD golden crosses
Because the upward trend can continue
There was no separate short position operation.
We responded by revising the stop loss.
Section 1 at the bottom is an upward traverse section.
Because a vertical decline can occur from the bottom touch
It may drop to section 2 in the early morning or after tomorrow.
If today's strategy succeeds
As I mentioned last week,
I think you can check the price of 100 million Bitcoin in Korean Won.
Because variables always arise in the market.
Please do not blindly trust it and only use it as a reference and use.
Please operate safely with principled trading and stop loss required.
thank you

Heading into 50% Fibonacci resistance, could it reverse?BTC/USD is rising towards a resistance level which is a pullback resistance that is slightly above the 50% Fibonacci retracement and could potentially reverse from this level to our take profit.
Entry: 69,495.60
Why we like it:
There is a pullback resistance level which is slightly above the 50% Fibonacci retracement.
Stop loss: 71,357.33
Why we like it:
There is a pullback resistance level which aligns with the 100% Fibonacci projection.
Take profit: 67,165.78
Why we like it:
There is an overlap support level.
Please be advised that the information presented on TradingView is provided to Vantage (‘Vantage Global Limited’, ‘we’) by a third-party provider (‘Everest Fortune Group’). Please be reminded that you are solely responsible for the trading decisions on your account. There is a very high degree of risk involved in trading. Any information and/or content is intended entirely for research, educational and informational purposes only and does not constitute investment or consultation advice or investment strategy. The information is not tailored to the investment needs of any specific person and therefore does not involve a consideration of any of the investment objectives, financial situation or needs of any viewer that may receive it. Kindly also note that past performance is not a reliable indicator of future results. Actual results may differ materially from those anticipated in forward-looking or past performance statements. We assume no liability as to the accuracy or completeness of any of the information and/or content provided herein and the Company cannot be held responsible for any omission, mistake nor for any loss or damage including without limitation to any loss of profit which may arise from reliance on any information supplied by Everest Fortune Group.

Potential bullish rise?BTC/USD has just bounced off a support level which is a pullback support that aligns with the 38.2% Fibonacci retracement and could rise to our take profit.
Entry: 68,780.38
Why we like it:
There is a pullback support level which lines up with the 38.2% Fibonacci retracement.
Stop loss: 57,088.62
Why we like it:
There is a pullback support level.
Take profit: 71,933.78
Why we like it:
There is a pullback resistance level which aligns with the 161.8% Fibonacci extension.
Please be advised that the information presented on TradingView is provided to Vantage (‘Vantage Global Limited’, ‘we’) by a third-party provider (‘Everest Fortune Group’). Please be reminded that you are solely responsible for the trading decisions on your account. There is a very high degree of risk involved in trading. Any information and/or content is intended entirely for research, educational and informational purposes only and does not constitute investment or consultation advice or investment strategy. The information is not tailored to the investment needs of any specific person and therefore does not involve a consideration of any of the investment objectives, financial situation or needs of any viewer that may receive it. Kindly also note that past performance is not a reliable indicator of future results. Actual results may differ materially from those anticipated in forward-looking or past performance statements. We assume no liability as to the accuracy or completeness of any of the information and/or content provided herein and the Company cannot be held responsible for any omission, mistake nor for any loss or damage including without limitation to any loss of profit which may arise from reliance on any information supplied by Everest Fortune Group.

Potential bullish rise?Bitcoin (BTC/USD) is reacting off the pivot and could rise to the 1st resistance level which is a pullback resistance.
Pivot: 68,734.67
1st Support: 67,111.57
1st Resistance: 71,439.85
Risk Warning:
Trading Forex and CFDs carries a high level of risk to your capital and you should only trade with money you can afford to lose. Trading Forex and CFDs may not be suitable for all investors, so please ensure that you fully understand the risks involved and seek independent advice if necessary.
Disclaimer:
The above opinions given constitute general market commentary, and do not constitute the opinion or advice of IC Markets or any form of personal or investment advice.
Any opinions, news, research, analyses, prices, other information, or links to third-party sites contained on this website are provided on an "as-is" basis, are intended only to be informative, is not an advice nor a recommendation, nor research, or a record of our trading prices, or an offer of, or solicitation for a transaction in any financial instrument and thus should not be treated as such. The information provided does not involve any specific investment objectives, financial situation and needs of any specific person who may receive it. Please be aware, that past performance is not a reliable indicator of future performance and/or results. Past Performance or Forward-looking scenarios based upon the reasonable beliefs of the third-party provider are not a guarantee of future performance. Actual results may differ materially from those anticipated in forward-looking or past performance statements. IC Markets makes no representation or warranty and assumes no liability as to the accuracy or completeness of the information provided, nor any loss arising from any investment based on a recommendation, forecast or any information supplied by any third-party.

One more trip to low $60Ks. Then Off To The Races.One possible scenario I'm watching.
One more little dump within the current range, just to confuse and frustrate everyone and try to get a few more cheap sats out of us.
Then convergence of the bull flag and inverse head and shoulders... rip upwards.
Target $90,800.

$70,000 continues to be an obstacle for BitcoinYesterday, Bitcoin again tested the resistance near $70,000 but failed. After soaring to $70,258, it quickly dropped below $69,000, where it currently trades. Overall, not much has changed from a technical perspective since our previous update; merely the sideways trend of a lesser degree became more apparent, with Bitcoin struggling at the $70,000 mark. As such, our focus continues to lie at this point, along with the two sloped channels shown below.
Illustration 1.01
The daily chart of Bitcoin (BTCUSD) above shows the descending channel, with its upper bound acting as an important resistance for the price. To support a bullish case in the short term, it would be ideal for Bitcoin to close above the resistance level for multiple consecutive days; the resistance’s importance grows with each retest.
Illustration 1.02
The image above shows the ascending channel within the larger descending channel; its lower bound acts as a resistance.
Illustration 1.03
The illustration above displays an alternative trendline on Bitcoin's (BTCUSD) daily graph, which acts as critical support for the price.
Technical conditions
Daily time frame = Neutral
Weekly time frame = Bullish (losing momentum)
Monthly time frame = Bullish
Bitcoin addresses
Initially, the number of Bitcoin addresses with balances exceeding 1,000 BTC increased slightly after the big slump we described on 29th May 2024. However, while this figure is still above its 28th May 2024 level, it resumed a decline in a new month, which is not a particularly positive sign. The same trend can be observed among the addresses with balances exceeding 100 BTC.
Please feel free to express your ideas and thoughts in the comment section.
DISCLAIMER: This analysis is not intended to encourage any buying or selling of any particular securities. Furthermore, it should not serve as a basis for taking any trade action by an individual investor or any other entity. Your own due diligence is highly advised before entering a trade.


Double Tap on the Resistance (Almost) No One is Talking About.. So here we are again, and most are still barely paying attention to this resistance level..
I was right about the first rejection here so lets see if we can make it 2/2..
Could that double tap finally signal the beginning of the real sell off?
BTC has lost that Green dotted support line and is in the process of retesting it as I type this.
Lets see what happens, but this would make for a REALLY bad time for traditional markets to sell off.. 😬
Right shoulder down to my Buy Zone incoming?

THE NEW PEAKDISCRIPTION
From 8-Nov-2021 to 4-Mar-2024 , bitcoin corrected the market structure in the shape of a semicircle after two months of trying to create a flag pattern , which indicated a rise
technically
the price is under upward pressure as long as trading continues at 65,521 to reach 71,203 and 73,736 by stabilizing at 71,203 will have a new peak other wise stabilizing below 65,521 will target the areas of 61,598 and 57,475 .
pivot line: 65,521
resistance line: 71,203 _ 73,736
support line: 61,598 _ 57,475

BTC Analysis June 03, 2024BTC Analysis
June 03, 2024
-
Bias:
- Mid-Term: Bearish
- Short-Term: Bullish
--
On the H4 timeframe, Bitcoin has successfully broken above its resistance trendline. To confirm further upward movement, the price needs to close above this level.
-
Main Interest Levels:
⬇️ Short: $68,760
⬆️ Long: $68,960
Predicted Daily Range: $73,937 to $62,994
--
Action Plan:
Bitcoin's price on the H4 timeframe has broken the resistance trendline and absorbed buy-side liquidity, suggesting possible rejection at this level. However, the price has also broken the neckline of the compression level, indicating potential for further upward movement after a retest.
Psychology, discipline, and capital management are the three essential factors for achieving victory.
If you find our analytics valuable, please show your support by liking and commenting. Your engagement is greatly appreciated!❤️
Trade Wave.

Follow the Pattern part2About the same volatility contractions in the same areas. Maybe candles 13 and 14 are needed but regardless, expect different volumes: up or down but will eventually make their way up.
I've included volume range measurements. I hope its different volume price will reach the SWB:69K zone and then dip to follow its pattern.
