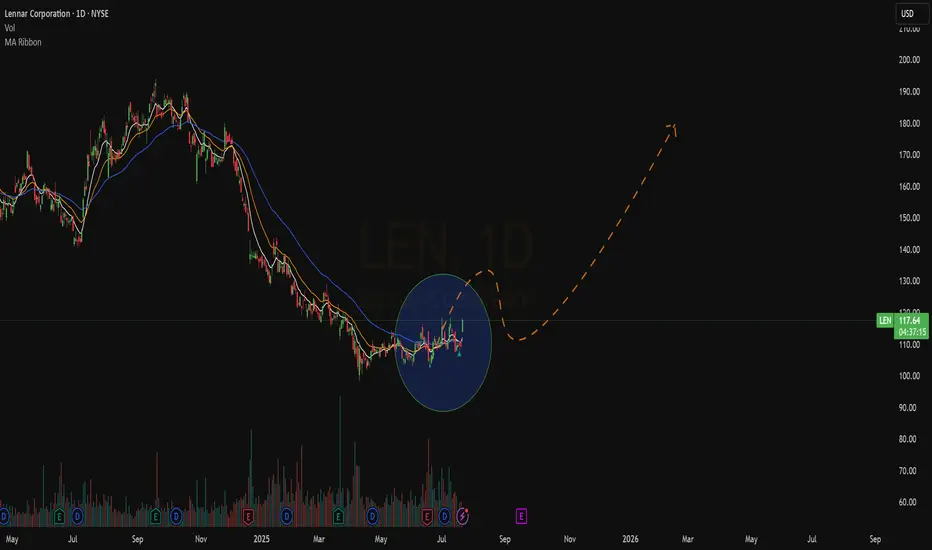
Waiting for Reversal before back to 140Bullish pattern not confirmed yet, waiting for reversal confirmation.
Next report date
—
Report period
—
EPS estimate
—
Revenue estimate
—
7.99 USD
2.06 B USD
34.13 B USD
211.90 M
About Lennar Corporation
Sector
Industry
CEO
Stuart A. Miller
Website
Headquarters
Miami
Founded
1954
IPO date
Jul 27, 1972
Identifiers
3
ISIN US5260571048
Lennar Corp. engages in the provision of real estate related financial and investment management services. It operates through the following segments: Homebuilding, Financial Services, Multifamily, and Lennar Other. The Homebuilding segment refers to the construction and sale of single-family attached and detached homes and the purchase, development, and sale of residential land directly and through entities. The Financial Services segment focuses on mortgage financing, title, and closing services for buyers. The Multifamily segment is involved in the development, construction, and property management of multifamily rental properties. The Lennar Other segment includes funds, asset management platform, and strategic investments in technology companies. The company was founded in 1954 and is headquartered in Miami, FL.
Related stocks

LEN- Lennar Corporation broke the bullish trend line and bounce off from support; the price managed to get back above the bullish trend
- Support is aligned with Fibonacci levels
- I'm looking at $244 to $274 price soon

Bullish peannant chart pattern and target for 125A bullish pennant is a continuation setup: a sharp upward “flagpole,” then a short, tight consolidation that looks like a small symmetrical triangle (lower highs + higher lows), and then a breakout upward.
It has broke R1 and R2, and has made strong bullish breakout

LEN Lennar Corporation Options Ahead of EarningsIf you haven’t exited LEN before the selloff:
Now analyzing the options chain and the chart patterns of LEN Lennar Corporation prior to the earnings report next week,
I would consider purchasing the 115usd strike price Puts with
an expiration date of 2025-12-19,
for a premium of approximately $1.6

LENTechnical Analysis – LEN (Lennar Corp.)
Current Price Action:
The stock is trading at $137.27, showing a recovery after a strong bounce from the uptrend line.
Price is now facing a supply zone around $137–$150, which may act as near-term resistance.
Major Trend:
The chart shows a long-term uptr

New Setup : $LENThe daily chart shows weakness, with double tops and lower lows in a bearish scenario given by bearish EMA and our S2 Alert popped out

BUY LEN at 132.32The price is rejected the strong zone of support
at 100 and started the up move by a bullish bars
then this week a strong bar with very big vomume is formed
so I opened long at 132.32
SL 105
TP 175

Lennar Corp | LEN | Long at $116.48Across the US, there is a pent-up demand for housing (for the vast majority of locations). While the media likes to selectively report home sales dropping for certain regions, it is more due to mortgage rates and seasonality than demand. Mortgage rates are anticipated to come down over the next 1-2

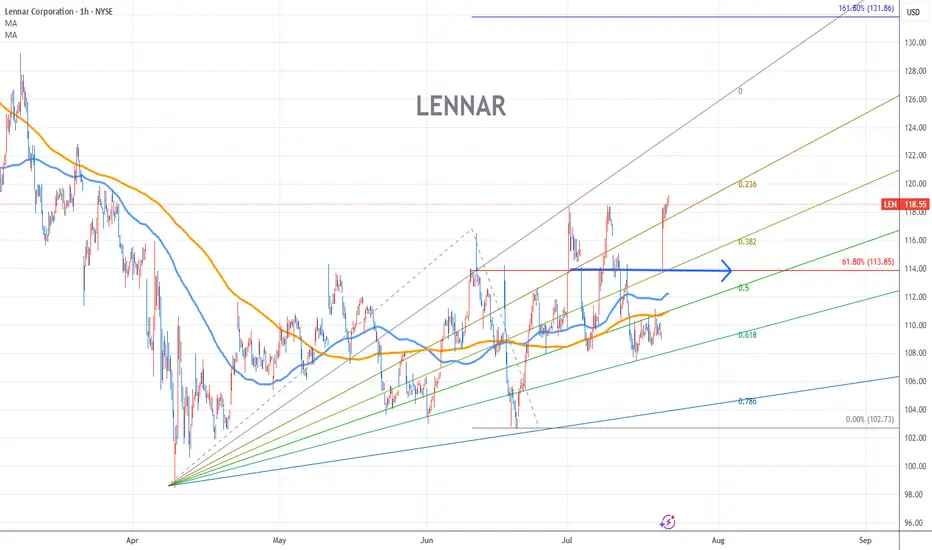
LENNAR Stock Chart Fibonacci Analysis 072225Trading Idea
1) Find a FIBO slingshot
2) Check FIBO 61.80% level
3) Entry Point > 114/61.80%
Chart time frame:B
A) 15 min(1W-3M)
B) 1 hr(3M-6M)
C) 4 hr(6M-1year)
D) 1 day(1-3years)
Stock progress:A
A) Keep rising over 61.80% resistance
B) 61.80% resistance
C) 61.80% support
D) Hit the bottom
E)
QuickView : LENThe daily chart looks juicy.
Great action today even so there is few volume and the spike is still into the range.
Bullish ATR, Box nearby the EMA Crossovers.
Ready to catch it
See all ideas
Summarizing what the indicators are suggesting.
Neutral
SellBuy
Strong sellStrong buy
Strong sellSellNeutralBuyStrong buy
Neutral
SellBuy
Strong sellStrong buy
Strong sellSellNeutralBuyStrong buy
Neutral
SellBuy
Strong sellStrong buy
Strong sellSellNeutralBuyStrong buy
An aggregate view of professional's ratings.
Neutral
SellBuy
Strong sellStrong buy
Strong sellSellNeutralBuyStrong buy
Neutral
SellBuy
Strong sellStrong buy
Strong sellSellNeutralBuyStrong buy
Neutral
SellBuy
Strong sellStrong buy
Strong sellSellNeutralBuyStrong buy
Displays a symbol's price movements over previous years to identify recurring trends.
Frequently Asked Questions
The current price of LEN is 114.56 USD — it has decreased by −0.56% in the past 24 hours. Watch Lennar Corporation stock price performance more closely on the chart.
Depending on the exchange, the stock ticker may vary. For instance, on NYSE exchange Lennar Corporation stocks are traded under the ticker LEN.
LEN stock has fallen by −2.50% compared to the previous week, the month change is a 5.56% rise, over the last year Lennar Corporation has showed a −10.92% decrease.
We've gathered analysts' opinions on Lennar Corporation future price: according to them, LEN price has a max estimate of 140.00 USD and a min estimate of 80.00 USD. Watch LEN chart and read a more detailed Lennar Corporation stock forecast: see what analysts think of Lennar Corporation and suggest that you do with its stocks.
LEN stock is 7.91% volatile and has beta coefficient of 0.59. Track Lennar Corporation stock price on the chart and check out the list of the most volatile stocks — is Lennar Corporation there?
Today Lennar Corporation has the market capitalization of 26.87 B, it has decreased by −3.62% over the last week.
Yes, you can track Lennar Corporation financials in yearly and quarterly reports right on TradingView.
Lennar Corporation is going to release the next earnings report on Mar 18, 2026. Keep track of upcoming events with our Earnings Calendar.
LEN earnings for the last quarter are 1.93 USD per share, whereas the estimation was 2.21 USD resulting in a −12.54% surprise. The estimated earnings for the next quarter are 0.96 USD per share. See more details about Lennar Corporation earnings.
Lennar Corporation revenue for the last quarter amounts to 9.37 B USD, despite the estimated figure of 9.00 B USD. In the next quarter, revenue is expected to reach 6.84 B USD.
LEN net income for the last quarter is 486.50 M USD, while the quarter before that showed 585.72 M USD of net income which accounts for −16.94% change. Track more Lennar Corporation financial stats to get the full picture.
Yes, LEN dividends are paid quarterly. The last dividend per share was 0.50 USD. As of today, Dividend Yield (TTM)% is 1.84%. Tracking Lennar Corporation dividends might help you take more informed decisions.
Lennar Corporation dividend yield was 1.52% in 2025, and payout ratio reached 25.05%. The year before the numbers were 1.15% and 13.97% correspondingly. See high-dividend stocks and find more opportunities for your portfolio.
As of Feb 3, 2026, the company has 12.53 K employees. See our rating of the largest employees — is Lennar Corporation on this list?
EBITDA measures a company's operating performance, its growth signifies an improvement in the efficiency of a company. Lennar Corporation EBITDA is 2.75 B USD, and current EBITDA margin is 8.05%. See more stats in Lennar Corporation financial statements.
Like other stocks, LEN shares are traded on stock exchanges, e.g. Nasdaq, Nyse, Euronext, and the easiest way to buy them is through an online stock broker. To do this, you need to open an account and follow a broker's procedures, then start trading. You can trade Lennar Corporation stock right from TradingView charts — choose your broker and connect to your account.
Investing in stocks requires a comprehensive research: you should carefully study all the available data, e.g. company's financials, related news, and its technical analysis. So Lennar Corporation technincal analysis shows the neutral today, and its 1 week rating is sell. Since market conditions are prone to changes, it's worth looking a bit further into the future — according to the 1 month rating Lennar Corporation stock shows the sell signal. See more of Lennar Corporation technicals for a more comprehensive analysis.
If you're still not sure, try looking for inspiration in our curated watchlists.
If you're still not sure, try looking for inspiration in our curated watchlists.