LINKBTC trade ideas


LINK ready to explodeLINK just formed a double botton and w pattern against the BTC pair, Link believers have being waiting for that move since the begging of the bull run.
Also, in the USDT graph we can clearly see a potential break of the bull flag leading LINK to the top of it´s channel from $45 to infinity.
Check out my USDT graph as well.

BUY THE DEEP of DIP 📣 (CHAINLINK/KING UPDATE)Another 📐 in 📐 👀
that will be explosive,,,
ALWAYz DYOR,,,
💚

[LINK] Still in a bearish trendLink still carries over the August 2020 "pre-pump" correction and has not performed well against other coins in this 2021 bullrun.
This can be demonstrated in this chart and IT IS STILL BEARISH. There is no confirmation yet that Link is going up by itself.
In the LOG chart, it has good and simple wave formations. I would expect either a sudden breakup or a 40k-60k consolidation before breaking up again.

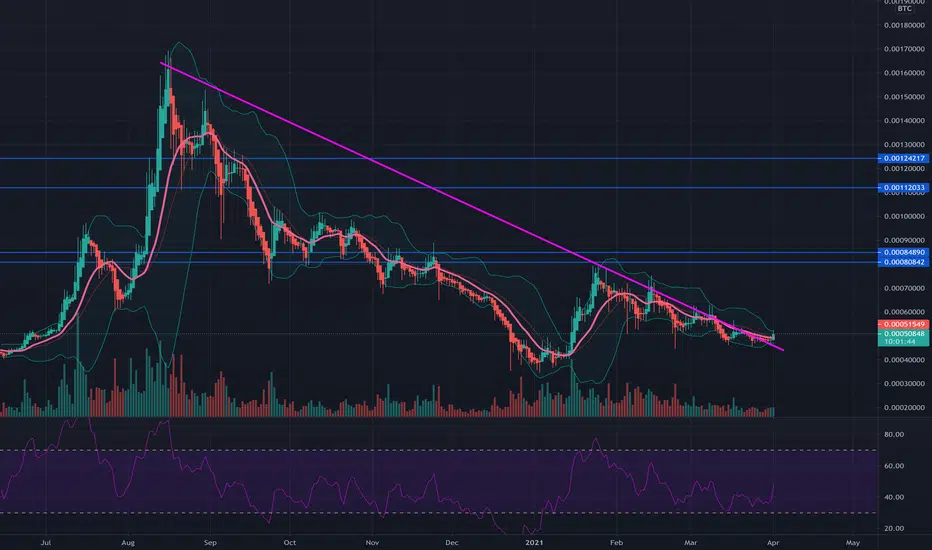
LINK / BTC Secondary trend. Falling wedgeA falling wedge has formed in the secondary trend. The price is near an uptrend main trend. A breakout of the wedge resistance will reverse this local downtrend. To understand where the price is in the main trend and the logic of work, see my previous trading ideas and work updates (price movement development).
Coin in question: Chainlink (LINK)

Chain Link Breakout +100% ROIChain link cryptocurrency price made successful breakout in trading chart and now looks good.
price can move higher from here and it can give us really good return in short time.
You can Buy your chainlink here below 52500 satoshi and hold for good return
Buy : below 0.00052500
Stop : 20% , 0.00041000
Target : 56K , 63K , 72K , 79K
Bitcoin price today made good gain and now bitcoin price is holding above the 55000 zone which is really bullish sign.
ethereum price also in bitcoin pairs made good breakout which can send all the btc pair price higher add some here and hold some link for good gain


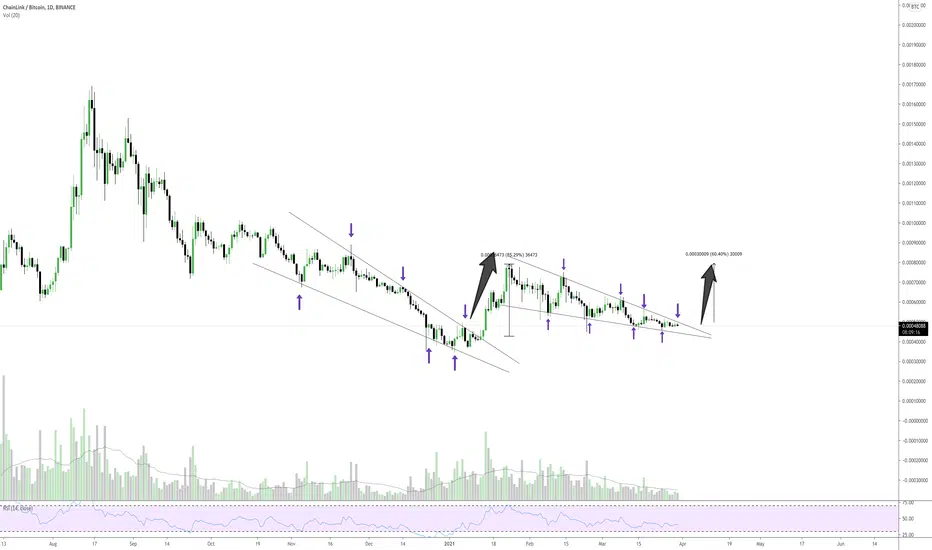
Chainlink Bitcoin breakoutIt looks like LINKBTC will bottom out and breakout the descending triangle


LINKBTC - DAYLINK is possible setting up for a major breakout.
The falling wedge pattern is getting very tight! Within a couple of days we should see a reaction.
For every new follower i will add a new idea :)
Linkbtc - short to medium termLink formed a nice double bottom the last time it was in this area that then created a strong push up. We've since seen it form a bit of a flag on this daily retracement which seems to have found a bottom at the resistance turned support of the double bottom.
Risky entry -- at the daily support that it's sitting now. The stop would have to be under the channel
Safer entry -- a break and retest of the descending triangle as it shows buyers are officially in control.
A descending triangle carries an inherently bearish bias since it's creating lower highs. However, where and how it forms needs to be taking into consideration. Meaning, if it forms as part of a downtrend it's most certainly bearish. BUT if it forms as a part of an overall uptrend / flag it can go either way.
I'm not interested in a short on this as the target sucks. However, the long targets are great imo.


Bullish Divergence RSISeeing bullish divergence on the 4 hour time frame, as well as an upside correlation with BTC at the moment. It is likely if BTC moves up or stays sideways we will see a breakout to the upside. However there has been a bearish correlation with BTC on the legs down, meaning we will fall harder when BTC has a leg down. Probability is finally on our side Marines!

Crypto|LINK/BTC|LongLong LINK/BTC
Activation of the transaction only when the blue zone is fixed/broken.
The author recommends the use of anchoring fixed the blue zone, this variation is less risky.
If there is increased volatility in the market and the price is held for more than 2-3 minutes behind the activation zone after the breakdown, then the activation of the idea occurs at the prices behind the activation zone.
The idea is to work out the resistance level .
* Possible closing of a trade before reaching the take/stop zone. The author can close the deal for subjective reasons, this does not completely cancel the idea and is not a call to the same action, you can continue working out the idea according to your data, but without the support of the author.
+ Maybe right now we will go even lower, then it's okay, the idea is not activated and simply canceled.
+ ! - zone highlighted by the ellipse is a zone of increased resistance, in this area there is a possible reversal for a correction, please take this factor into account in this transaction.
The "forecast" tool is used for more noticeable display of % (for the place of the usual % scale) of the price change, I do not put the date and time of the transaction, only %.
Blue zones - activation zones.
Green zones - take zones.
The red zone - stop zone.
Working out the stop when the price returns to the level after activation + fixing in the red zone.
Orange arrow - the direction of take.
Black arrow - neutral scenario without activating the trade.
The red arrow - the direction of the stop.
SUM PNL: This parameter displays the total % of all closed ideas of the "new" format (according to the author) for this sector at the time of publication of the idea. The calculation is very "clumsy" just the sum of the profits of all the ideas, based on this indicator, you can more accurately assess the risks when working with my ideas of this sector. I present you the construction of the idea, you can use it yourself as you like based on your subjective view and risks, the calculation of the PNL indicator is carried out only on transactions that the author closed on TV in manual mode or by take.
P.S Please use RM (risk management) and MM (money management) if you decide to use my ideas, there will always be unprofitable ideas, this will definitely happen, the goal of the system is that there will be more profitable ideas at a distance.

🔥 LINKBTC 🔥 +50%What is LINK (Chainlink)?
Chainlink is a cryptocurrency aiming to incentivize a global network of computers to provide reliable, real-world data to smart contracts running on top of blockchains.
If you’re unfamiliar, smart contracts are agreements programmed to execute if and when certain conditions are met. To date, smart contracts have been used for everything from creating novel crypto-financial products to developing new crypto assets.
However, an issue that has persisted is that most smart contracts need to rely on some kind of external data source to properly execute their terms.
For example, smart contracts seeking to replicate bonds or insurance agreements may need access to APIs reporting on market prices or Internet of Things data.
Chainlink was created to address this issue by incentivizing data providers (called “oracles”) to act as a bridge between blockchain smart contracts and external data sources.
Every oracle within the Chainlink network is incentivized to provide accurate data since a reputation score is assigned to each. Further, when nodes follow the software’s rules and provide useful data, they are rewarded in Chainlink’s cryptocurrency, LINK.
Arriving amid a crowded field of projects in 2017, the Chainlink team has so far been able to deliver on its vision, expanding efforts beyond Ethereum (ETH) amid a surge in market activity.
As of 2020, Chainlink is seeking to support all blockchain-based smart contract networks.
Users seeking to stay connected on the current development status of Chainlink can follow its official project tracker for up-to-date details.
** Do your own research And... never forget... "Buy low, Sell High"!!!
See you Tomorrow!!
Miguel


A Swan Song for LINK MarinesAn ultra-long time frame analysis for LINK/BTC:
“I bought an altcoin in November 2017 and I was up by 92x on my buy price in August 2020. I am up by 28.3x on my buy price in March 2021.”
If someone told you this to you, you would think it was a joke given the brutal retrace most alts saw over 2018 – 2020. During this period, XTZ and LINK were two altcoins that created the next generation of moonboys who would tell you ETH doesn’t scale and shill you some DeFi coin.
Going forward here is a contrarian view: LINK outperformed most alts spectacularly during the bear market. Charting on weekly timeframe suggests that LINK will underperform most defi alts in a spectacular manner during the bull market.
Features of the chart:
1. Bullish TK cross in November 2018, Bearish TK cross in Jan 2021: Suggests the major rally is OVER. What remains is potential “sucker’s rally” for Marines to believe in.
2. During the bull run, price bounced on Kijun and Tenkan several times. Any break below Kijun was quickly recovered without affecting the long term trend (no bearish T-K cross)
3. VPVR suggests most of the accumulation occurred below 12000 sats.
4. Volume has gone down over the long term.
Forecasts: After such a strong long term move, expectation of a strong bull run is unrealistic. Still as a level headed person here are two scenarios. The bearish/neutral case is more likely:
1. Bullish case: Price reverts back to tenkan, uses that as support and approaches the cloud. The Kijun here is flat, so is the cloud. MASSIVE resistance. This should be the long term target ~ a 2x. A potential bull div on the RSI will need to occur. The question is: are you better off taking a trade elsewhere?
I wouldn’t expect price to break through this unless the old marines recruit new marines and concentrate all the liquidity in LINK. With so many DeFi plays coming up, liquidity will get more and more dispersed.
2. Bearish case: Tenkan acts as resistance and we form a massive descending triangle. Break down to about 30k sats. This may occur if the LINK team and advisors continue to dump millions of LINK on the market. Make no mistake, they have plenty left in their tanks.
EVEN in my bearish case, you would be up about 18x if you bought in Nov 2017. Still a positive outcome that hodlers of other alts would be grateful for today.

$LINK/BTC Looks Prime to Retest 150000 satsIf monthly DMACD_LB continues bullish trend expect this guy to do at least a cool 300%. Trade safely friends.

LINK BITCOIN BATTLE CONTINUESIf the valuation of LINK/BTC continues to drop, I have noted a solid price floor support level. This has been a key level for nearly 2 years now! There is a slow uptrend forming over the past few weeks, and if we continue, I would expect a stronger move up in the next few weeks or so. Please feel free to follow us on Twitter, Youtube, and Telegram!
