$LINK / $BTC Warning to all you $LINK fans, watch out for this breakdown in price if support does not hold!
LINKBTC trade ideas

LINKBTC - Critical ZoneNow..
We came very close to the resistance line of descending channel.
Until a few hours ago, the uptrend scenario was more likely to happen. But now the situation is different
We are waiting to see what happens to react appropriately.


LINK/BTC: Imminent Breakout Analysis - 1D, 1HIn this post, I'll be providing an analysis on Chainlink (LINK), shedding light on its daily and hourly chart through technical analysis.
Daily Chart Analysis
- To begin with, the daily chart is on the left, and the hourly on the right
- The daily chart demonstrates that prices are trading within a descending channel, forming lower highs and lower lows
- The Relative Strength Index (RSI) is at neutral levels, showing signs of a potential breakout
- The Moving Average Convergence Divergence (MACD) is forming a potential death cross, but has not provided confirmation yet
- We can interpret the current setup as a consolidation phase of a bullish flag pattern
- Should we see prices break through the upper channel resistance, we could potentially expect another leg up to 0.002btc
Hourly Chart Analysis
- Zooming in on the hourly, we see clearer signs of bullishness
- Prices are forming an ascending triangle pattern, in which the tops of the pattern are rejected at 0.000894 btc levels, while higher lows are formed
- The RSI is also in an uptrend, forming higher lows as a sign of momentum building up
- Based on the ascending triangle pattern, we can count Elliott triangle waves (ABCDE)
- This wave count shows that a breakout through the triangle pattern is very imminent
- The 100 Simple Moving Average (SMA) on the hourly chart is a good reference of support/resistance zones.
You can check out my other analysis on Waves (WAVES) which had a very similar setup: an ascending triangle within a descending parallel channel.
Conclusion
Chainlink seems like it's headed to retest previous highs as indicators and bullish pattern setups demonstrate potentiality for a breakout.
However as always, don't predict the market. Take it by levels, and play by probabilities.
If you like this analysis, please make sure to like the post, and follow for more quality content!
I would also appreciate it if you could leave a comment below with some original insight.


Link still room for move downOne leg still missing for drop to be completed. Next week potentially as dollar index is still looking strong.

LINKBTC| 44% Profit in less than 20 daysBINANCE:LINKBTC might move upward after hitting the support level. If the price showed an upward trend there might be a really good opportunity to go long and place our TP at the nearest resistance level.
Entry price : 0.00087
Take Profit : 0.00125
.
.
.
.
What do you think about this strategy, share your comments bellow;
Make sure to subscribe !
If you enjoyed this Idea hit the Like button and support us!


LINKBTC - POSSIBLE BULL FLAG I believe price is forming a bull flag if not break below the trendline, of course.
Great R&R potential.
Stop is somewhere below the trendline.
DYOR!
Not a financial advice.


LINKBTC bounced on a daily support 🦐LINKBTC bounced on a daily support and the price is testing 0.5, 0-618 Fibonacci level.
IF the price will break the descending channel, According to Plancton's strategy, we can set a nice order
–––––
Follow the Shrimp 🦐
Keep in mind.
🟣 Purple structure -> Monthly structure.
🔴 Red structure -> Weekly structure.
🔵 Blue structure -> Daily structure.
🟡 Yellow structure -> 4h structure.
⚫️ Black structure -> >4h structure.
Here is the Plancton0618 technical analysis, please comment below if you have any question.
The ENTRY in the market will be taken only if the condition of Plancton0618 strategy will trigger.


Dow three market phases on CHAINLINK.The primal trend based on the weekly chart is bullish
The second trend is bearish since the price is down-trending
The third trend is bearish as well


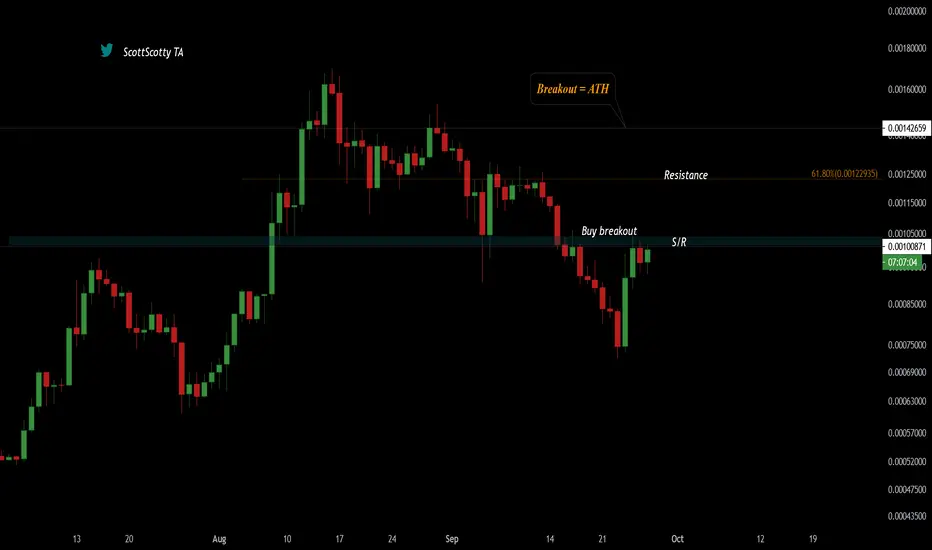
LINK BTC THIS ANALYSIS IS BASED ON LEVELS ...IF DAY CANDLE CLOSES ABOVE THE MENTIONED LEVEL THAN U CAN TAKE ENTRY ...

LINK/BTCI'm long from 97k sats if you guys want to go long wait for daily / weekly close on top of S/R...
L i n k / B T Cwill try to long as close as possible to the red line (maybe i will miss the move
(SPOT)

LINKBTC MOVES DOWNThe exact day when BTCUSDT reached its 2020 high (16 Aug), LINKBTC has started its downtrend. This trend seems to be fit well in the channel as the chart presents. If the price do not penetrate the trendline and falls again, we will see the LINKBTC price around the channel line during a few days ahead with some probable pause and retracement on sup/res lines. By the way, an increase in volume around the trendline make sense!

LINK BULLRUN CONTINUESNot so much to talk about the best Crypto project i've been into for a long time now, I don't see a point whereby we'll talk about Link's downfall! The chart says it all, 4 Swing positions you can hang on.
ENTRY - 0.00091898
TARGET 1 - 0.00101448
TARGET 2 - 0.00107947
TARGET 3 - 0.00122092
TARGET 4 - 0.00153821
SL - SUPPORT - 0.00080301
