selby_exchange - LINKXBT - Selby Chainlink Price ForecastLINKXBT price/time call
0.00121123
2020-08-14
Selby finding creative patterns in charts on Tradingview!
Not advice for investing lol, but I am one to watch ;)
Rebellion=Change=Future
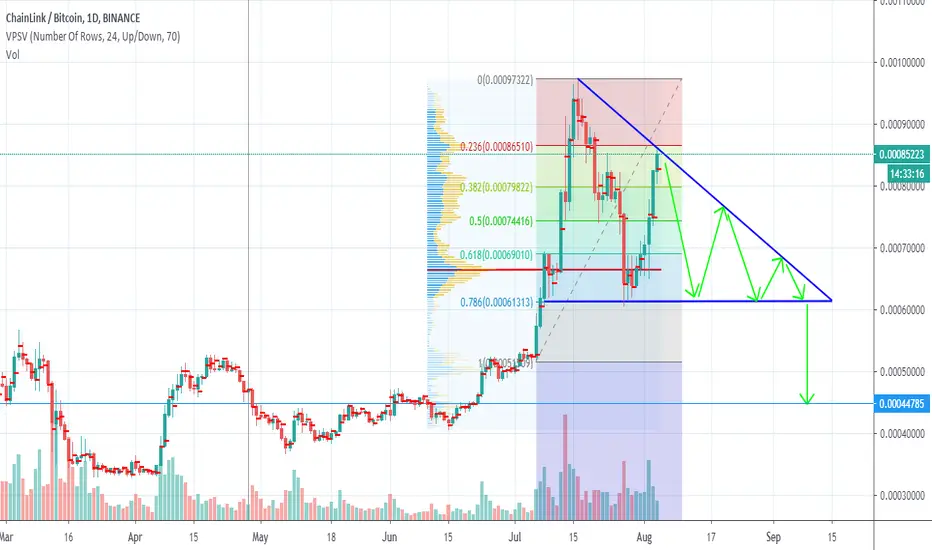
LINKBTC trade ideas

LinkBtc apex point setlink looks to be consolidating until around 25 august before bullish continuation imo


LINK preparing for ATHPlease feel free to comment or challenge me on my TA. If you like my idea, leave a like to show support.
--------------------------------------------------------------------
- Parabolic move up since the beginning of times
- Ascending triangle structure
- MACD positive territory
Expecting a retest of the support line after which the breakout can occur.
Buy order set above resistance line as the BO should be a quick move.

$LINK, Reclaiming & flipping back to support ~78k sats level$LINK
Reclaiming & flipping back to support ~78k sats level
Continuation from here (Volume needs start rising again), could lead back to ATH BTC levels (94k sats // ~15%)
UCTS remaining bullish across all HTFs. BTC activity can lead to new dips/opportunities
#LINK

$1000 Chainlink is fud Strongest project in the space right now, incredible fundamentals and technicals. A mere 10x away in btc away from being $1000 USD when Bitcoin hits 100k
When Bitcoin hits a million USD per coin Chainlink with have unfathomable gains. We have broken out of the 'accumulation' phase of the Chainlink market cycle, the smart money has already taken positions. If you want to know what comes next all you need to do is look at a chart of ETH when it went from $10 to $1000+ in just a few months.
Don't get left behind! Buy now! This is not financial advice, it is a financial COMMAND.

LINK - DO NOT SELL YETHello,
the bad candle today was due to
1-the linkusd price to approach the psychological level of 10$, and many people set a TP slightly below in order to make sure it was triggered.
2- a retest of the fibo retracement area in the linkbtc chart. As far as we do not fall in it again, I am still bullish.


Chainlink High & Tight FlagIn my honest opinion we have just made this target with a possible doubling if Bulkowski chart pattern analysis plays out?
thepatternsite.com

LINKBTC H2Absolutely fantastic!
1. High flamula.
2. Didi needles high.
3. High ADX.
4. Trix indicating purchase.
5. High pivot.
6. Without brake.
What a beautiful thing to see


LINK/BTC - Bull Flag Breakout!Hello Future Millionaires!
The market has blessed us and I am so thankful for the abundance! LINK/BTC is still looking bullish!
Looking to long this bull flag for a final profit target at the top of the measured move.
Nothing fancy, just simple support/resistance and pattern trading!
Have a wonderful Sunday fun day and great week!
Follow us now to stay up to date with life changing technical analysis strategies!!!
---
Guide to My Charts
-The horizontal purple boxes of peace and prosperity are support/resistance 'zones'. If price pierces through one side, then it is likely to head toward the next support/resistance zone or line.
-The purple lines are support/resistance lines.
-Yellow lines are typically used to chart out pattern formations on the daily and higher time frames. Skinnier red lines may are typically smaller time frame trends (like 4H and 1H).
-The colored lines are MAs (Red: 10 simple, Yellow: 21EMA, Green: 55EMA, Blue: 89EMA, Grey: 200EMA, White: 200SMA, Maroon: 377EMA.
-Horizontal white and green lines may be Fibonacci levels. The 0.382 and the 0.618 Fibs are green and the rest are white.
-The Historical Volatility Percentile (HVP), RSI, and/or stochastics indicators are below the chart if displayed.
---
Please leave a like and comment if you find value in this post! It is a really quick and effective way to show your support!
---
This is not financial advice; I am not a financial adviser. This information is not meant to be used for financial advice, nor trade ideas. These posts are simply a record of my trade ideas and are intended for educational purposes only.

LINK / BTC - Swing Trade / long-term investmentOscillators indicate buying signals for LINK on the LINK/BTC chart at the 1D TF.
LINK has completed an ABC correction which has found support on the 50 SMA and now there is enough bullish momentum for a 13-23% pump (entry between 0.000691-0.0006674) before a further correction to the downside (which is indicated on higher TFs).
Swing Trade LINK-BTC (R:R=1.5-1.6):
entry#1: 0.000691-0.0006674;
TP1@0.000784;
TP2@0.000799;
TP3@0.000848, with 3% TTP
NO stop loss recommended for this crypto for fundamental reasons
(in case price falls considerable lower, add more LINK to your portfolio -> accumulate it and hodl/stake it for long-term)
I´m not a financial adviser. For educational purpose only!

LINK/BTCLINK has retraced to 0.718 fib level from the current ATH. Reclaiming the diagonal resistance would confirm bias for upside potential.
Note: If you like the content and the setup, please give me a follow not to miss out on many altcoins charts to come.


LINK/BTC - Ascending Triangle - 85.86% Profit PotentialHello Future Millionaires!!!
LINK has just seen a pullback to the 0.5 Fibonacci on the daily. It then bounced straight up to the 0.382 Fibonacci where it has been finding resistance.
We can see an ascending triangle forming on the daily and the measured move has confluence with daily resistance zone around 75000 sats.
We are currently sitting on strong daily support and are at the bottom of a triangle formation on lower time frames.
Lower time frame oscillators are getting into the oversold range and are looking like they want to flip around to the upside. If those oscillators start to turn up in unison, we start closing above some of the lower time frame moving averages, and volume increase, then I suspect the target will be met, then surpassed!
This is a simple buy support, sell resistance trade using Fibonacci. support/resistance zones, momentum oscillators, and patterns to offer up an edge!
A better risk:reward trade setup would be to wait for price to touch the 0.5 Fibonacci/yellow diagonal trend line on the bottom side of the ascending triangle. However, price may not go back down that far.
Let's get this crypto!
---
Entry: 0.00066046
T1: 0.00067500
T2: 0.00068500
T3: 0.00069000
T4: 0.00071500
T5: 0.00073000
T6: 0.00074500
T7: 0.00075500
Stop: 0.00064495
--
R:R: 3.68
Risk: 3.89%
Reward: 14.31%
Leverage: 6X
Leveraged Risk: 23.34%
Leveraged Reward: 85.86%
---
Guide to My Charts
-The purple lines are horizontal support/resistance lines.
-Yellow lines are typically used to chart out pattern formations on the daily and higher time frames. Skinnier red lines may are typically smaller time frame trends (like 4H and 1H).
-The colored lines are MAs (Red: 10 simple, Yellow: 21EMA, Green: 55EMA, Blue: 89EMA, Grey: 200EMA, White: 200SMA, Maroon: 377EMA.
-Horizontal white and green lines may be Fibonacci levels. The 0.382 and the 0.618 Fibs are green and the rest are white.
-The Historical Volatility Percentile (HVP), RSI, and/or stochastics indicators are below the chart if displayed.
---
Please leave a like and comment if you find value in this post! It shows me who that people are interested and helps motivate me to share more thorough technical analysis with the community!
---
Disclaimer:
This is not financial advice; I am not a financial adviser. This information is not meant to be used for financial advice, nor trade ideas. These posts are simply a record of my trade ideas and are intended for educational purposes only.

