830 Risk reward ratio trade on LINK.Weekly vol on LINK is crushed. Wyckoff pattern on USD chart. Super tight stop on this trade.
LINKBTC trade ideas

Beautiful inverted Head and Shoulder pattern If we break the neckline, we are in for a fantastic BULL RUN in Q4!
BIST:LINK CRYPTOCAP:BTC

✳️ Chainlink Bullish Since June (75% Target Mapped)No new lows since June... We have a perfect pattern of up, correction and then more up; which is a bullish pattern.
The correction for the June/July bullish breakout ends exactly above the 0.618 Fib. (golden ratio) retracement level and volume fully supports this pattern as a small correction or retrace.
We can expect a higher high next compared to July's peak based on the above price action.
Volume is low but likely to be higher when looking at other exchanges. While low, still leaning towards the bulls and many times above the daily average, in the last few days.
Many bullish signals on this chart and resistance is being challenged today.
✔️ 100% bullish all across.
Patience is key... Thanks a lot for your support.
Namaste.

As announced recently: Chainlink Bull Run has startedIf you want to know most probable Chainlink trajectory, follow that chart.
BINANCE:LINKUSD

CHAINLINK LINK/BTC pair 2 major trends have existed in LINK/BTC price history. Both ~3 years. Or 1000 days. Next trend break will direct this Upwards, and it could be for years
The God Protocol

LINK/BTC target tuchIntroduction:
In this price analysis, we will explore the price trends of the LINK/BTC trading pair. Starting from April 2024 onwards, we have witnessed significant growth in the price. Considering a projected price of $120,000 for Bitcoin (BTC) in 2025, the LINK price range is expected to be between 0.001 and 0.0016 Satoshis. It is important to exercise caution and not be overly greedy, as the price of LINK is estimated to range between $100 and $190 during this period.
Analysis:
The LINK/BTC pair shows promising upward momentum since April 2024. With Bitcoin's projected growth, LINK has the potential to offer substantial returns. However, it is crucial to maintain a balanced approach and refrain from being excessively eager to sell at high prices. A range of 0.001 to 0.0016 Satoshis presents an appropriate opportunity to consider selling LINK holdings.
Conclusion:
As we analyze the price chart for the LINK/BTC pair, it becomes evident that the future holds potential for profitable returns. With Bitcoin's projected price surge and the estimated range for LINK, careful evaluation and strategic decision-making are essential. By avoiding excessive greed and carefully selecting an optimal selling range, traders can maximize their gains while maintaining a prudent approach to the market.

✳️ Chainlink [NYA]Quick and simple: Chainlink is coming out of a major downtrend. This downtrend is now completely broken marked by the bottom pattern and high volume on the ensuing bullish breakout.
Prices now trading above EMA100 and MA200 is all the confirmation we need.
After a downtrend comes an uptrend, this uptrend can extend to the long-term.
This is a very strong bullish setup that points to straight up.
Great momentum, maximum speed and growth.
Namaste.

LINK/BTC - Bullish pattern playing outI see this pattern playing out which can result in Link/USDT going up to $200

LINK Inverse H&S successfulThe Link trade ended up reaching first target.. I H&S retested neckline and broke up.. consolidating now entering ichimoku cloud, base line supporting the price and the lagging span over the price, bullish

LINKBTC new shortPrevious short (related idea) i followed for 5 monthes and 8 days,
We had reached the 0,000225 target today.
But with the development of trend, I found that we have a potential downward wedge, in which wave E corresponds to the corrective wave 4 of the previous driving wave 3.
I expect we will push the support around the end of july, but these patterns sometimes have a false break, so we may bottom a little earlier.
Also i have alternative calculations marked by vertical lines - middle of October or middle of December.

LINK / BTC H&S local bottomLINK is forming a head and shoulders bottom, on a daily timeframe, if this turs out to be legit, it could give a pump of at least 15% targets are weekly 12EMA and 21EMA

LINKBTC short to 0.000273 weekly closed bearish
I am canceling my long now, strong signal for changing the shoes
First target is black line, breaking of it will send us to white one

LINK/BTC Monthly bullflagVolume for LINK has fallen off massively, in USD it has been stuck in a accumulation range but on the BTC chart it has painted a bullflag with a impressively high target. Link is winding up for a explosive break out soon

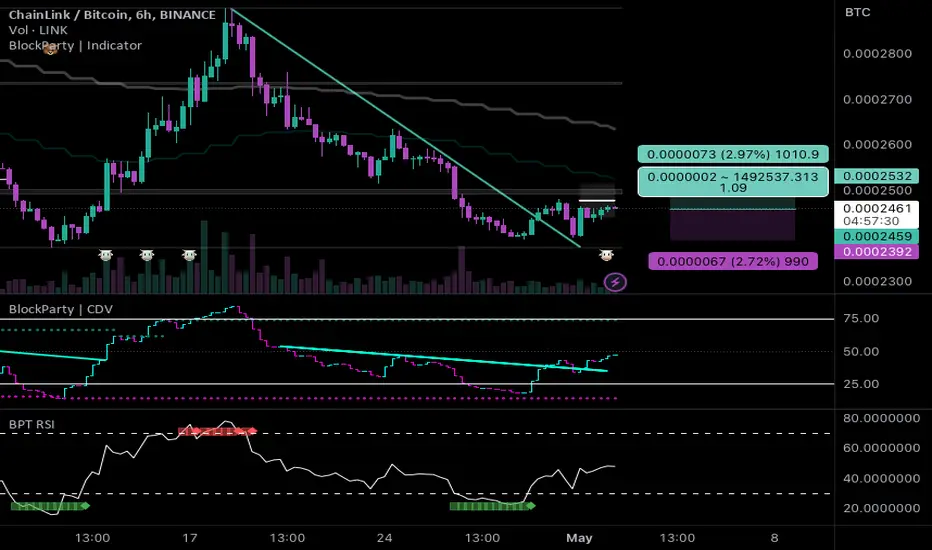
#LINK/BTC - Long - Potential 3%Direction: Long
Market: Spot
Risk: 0.25% - 1%
#BTC_LINK
Exchange: BINANCE
Timeframe: 360
TP1: 0.0002532
Entry: 0.0002462
STOP: 0.0002392
Entry Conditions:
| Trendline break
| CVD Trend break
| Bounce from oversold
On the verge of a MASSIVE move upwards, $LINK Power engagedThe BTC pair leads the charge and the USD pair's gains will be exponential

✳️ Chainlink vs Bitcoin Long-Term Higher Low | Trade or Learn?You need multiple signals to reach a conclusion...
Should I just go straight to the numbers, the chart with its potential or explain the signals?
Because one way is like teaching/learning, the other one is like showing an opportunity/trading.
12-April ends in a Doji with a perfect (-9), that's the TD Sequential indicator:
This is followed by three green candles, rising volume, bullish divergence with the RSI as the RSI moves above 50.
New low yet above 50 that's a very strong signal.
Also, we have multiple bullish signals and that's all we need.
Finally, the long-term higher low on the main chart.
That's it!
LINKBTC goes bullish.
Enjoy your weekend.
Namaste.

LINK/BTC - Chainlink: BBand_Breakout◳◱ A Bollinger Band breakout has been identified on the BIST:LINK / CRYPTOCAP:BTC chart. The price has moved outside of the upper Bollinger Band, indicating a potential bullish trend. The next resistance key levels are located at 0.0002629 | 0.0002714 | 0.0002847, and the major support zones can be found at 0.0002496 | 0.0002448 | 0.0002315. Consider buying at the current price zone of 0.0002577 and targeting higher levels.BBand_Squeeze
◰◲ General info :
▣ Name: Chainlink
▣ Rank: 21
▣ Exchanges: Binance, Kucoin, Huobipro, Poloniex, Bittrex, Kraken
▣ Category/Sector: Services - Data Management
▣ Overview: Chainlink is a decentralized oracle network. It aims to serve as a middleware between smart contracts on smart contracting platforms and external data sources, allowing smart contracts to securely access off-chain data feeds.
◰◲ Technical Metrics :
▣ Mrkt Price: 0.0002577 ₿
▣ 24HVol: 151.488 ₿
▣ 24H Chng: 2.588%
▣ 7-Days Chng: 9.90%
▣ 1-Month Chng: 17.55%
▣ 3-Months Chng: 17.09%
◲◰ Pivot Points - Levels :
◥ Resistance: 0.0002629 | 0.0002714 | 0.0002847
◢ Support: 0.0002496 | 0.0002448 | 0.0002315
◱◳ Indicators recommendation :
▣ Oscillators: BUY
▣ Moving Averages: STRONG_BUY
◰◲ Technical Indicators Summary : BUY
◲◰ Sharpe Ratios :
▣ Last 30D: 1.58
▣ Last 90D: 1.09
▣ Last 1-Y: -0.25
▣ Last 3-Y: 0.78
◲◰ Volatility :
▣ Last 30D: 0.67
▣ Last 90D: 0.68
▣ Last 1-Y: 0.93
▣ Last 3-Y: 1.17
◳◰ Market Sentiment Index :
▣ News sentiment score is N/A
▣ Twitter sentiment score is 0.59 - Bullish
▣ Reddit sentiment score is 0.87 - V. Bullish
▣ In-depth LINKBTC technical analysis on Tradingview TA page
▣ What do you think of this analysis? Share your insights and let's discuss in the comments below. Your like, follow and support would be greatly appreciated!
◲ Disclaimer
Please note that the information and publications provided are for informational purposes only and should not be construed as financial, investment, trading, or any other type of advice or recommendation. We encourage you to conduct your own research and consult with a qualified professional before making any financial decisions. The use of the information provided is solely at your own risk.
▣ Welcome to the home of charting big: TradingView
Benefit from a ton of financial analysis features, instruments and data. Have a look around, and if you do choose to go with an upgraded plan, you'll get up to $30.
Discover it here - affiliate link -

Inverse Chart: Cup n' Handle - Short LinkThere's an inverted cup/handle on the weekly link/btc chart. I've inverted the chart. Short link vs. bitcoin if we breach and hold beyond the neckline. Measured 1x and 1.5x targets are shown on the chart. Dashed line is 0.5x.

LINKBTC - Falling Wedges Within Down ChannelLINKBTC is showing a falling wedge within a down channel
Once the bottom of the wedge is reached it is possible that price will break out of the channel
Bearish within channel, bullish out of channel

Chainlink. CCIP edition.Here we are again. Treading water.
Speculation as to CCIP release in March, would line up with a breakout in the chart against BTC. Chainlink is notorious for missing deadlines, however it doesn't hurt to map out possibilities.
The chart must break upward from the blue Gann line otherwise it will make new lows against BTC. NFA.


Link BTC - eying 90% gain - in this downward market crashBeen watching Link for quit some time - I use longer time frames. on BTC chart. we have broken the falling wedge - as long as we hold weekly above 4000 satoshi. Broken a gann fan which it has been holding for quite some time.
This is one gigantic falling wedge. but you got to zoom out to see it. sometimes less noise from the market is better - and focus on the bigger picture.
Falling wedge - Next wave major - wave 5 . But lets not be greedy - will just target 0.618 fibo range as a medium term trade.
On USDT pair - we can see the gann angles - and a very clear accumulation pattern at the current range - the liquidity pool is used to accumulate more link. Very clear to see on the current size of the volume bar. Many alts broken down and made a lower lows, while link held the gann angle well. target is around 87% on usdt to the next zone as a minimum.
In addition, link is developing quite nicely and they have stacking incoming in December.
If there is anything currently in the market - there are only 4 tokens I've got my eyes on after completing from Matic and BNB. Currently Link is one of them.
Better image attached.
