Long matic ideaWaiting for price to interact with below 4h fvg. Range low mitigated and price came back to range.
MATICUSDT.P trade ideas


MATIC - Beautiful Wyckoff Reaccumulation Flag w/SpringCRYPTOCAP:MATIC
This Matic flag w/spring has played out many times before within this pair with the same volume profile after sweeping the highs and the lows.
What we love to see is reclaiming support, with declining volume from the highs then coiling into an ABC flag after sweeping the most recent highs prior to the spring is spectacular...
Number Go Up IMO

MATIC ANALYSWe have displayed the trend of the matic currency on a very clear chart... with capital management, you can control the risk and achieve reasonable profits.
Please follow us to provide better service and if you are satisfied, introduce us to your friends

MATICUSDT.1DBased on the provided market data, the cryptocurrency MATIC is currently trading at $0.79 against USDT. The Relative Strength Index (RSI) for 4 hours, 1 day and 7 days are 56.35, 49.23, and 52.23 respectively. These figures indicate that the coin is neither in an overbought nor oversold condition, suggesting a balanced market sentiment.
The Moving Average Convergence Divergence (MACD) for 4 hours, 1 day, and 7 days are 0.0012, -0.012, and 0.023 respectively. A positive MACD indicates that the crypto is on an upward trend, while a negative one suggests a downward trend. Here, the MACD data suggests a mixed trend.
The Bollinger Bands (Bb) for 4 hours, 1 day, and 7 days are 0.80, 0.83, and 1.00 respectively. The current price is below the upper band for all periods, indicating a potential for price growth.
In terms of support and resistance levels, the first, second and third support levels for 4 hours are 0.77, 0.72, and 0.68 respectively. For 1 day, they are 0.74, 0.68, and 0.60. For 7 days, they are 0.68, 0.60, and 0.49. The resistance levels for 4 hours are 0.83, 0.87, and 0.94. For 1 day, they are 0.94, 0.98, and 1.074. For 7 days, they are 0.96, 1.10, and 1.22.
Overall, MATIC is showing mixed signals with a balanced market sentiment. The positive 4h MACD and the placement of the current price below the Bollinger Bands' upper limit suggest potential for price growth, but the negative 1d MACD indicates a possible downward trend. Therefore, investors should closely monitor market trends and indicators, and consider their risk tolerance and investment objectives before making investment decisions.

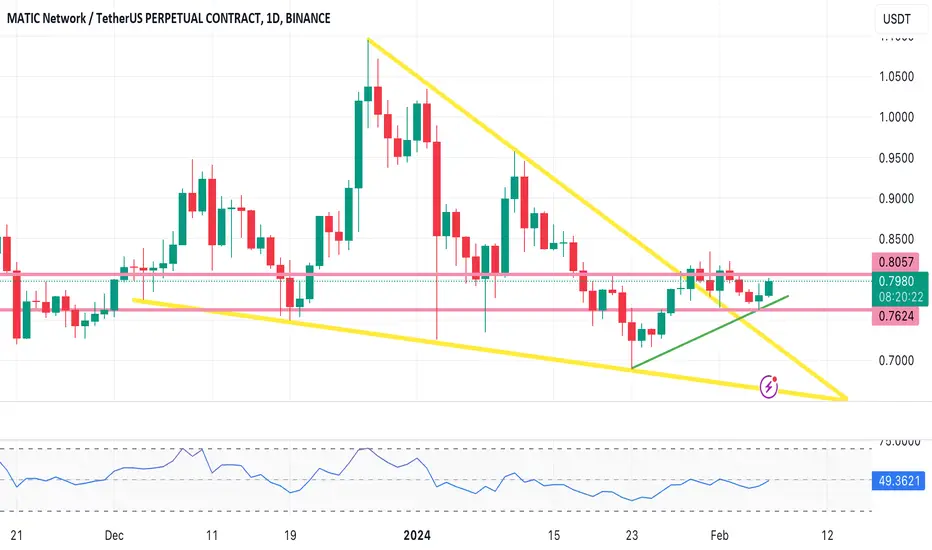
$MATIC BreakoutMATIC Polygon is breaking out from its downward trend. A break above $.8057 will give steam to make it past $.8197 and on its way to $.99.
Do your own research.
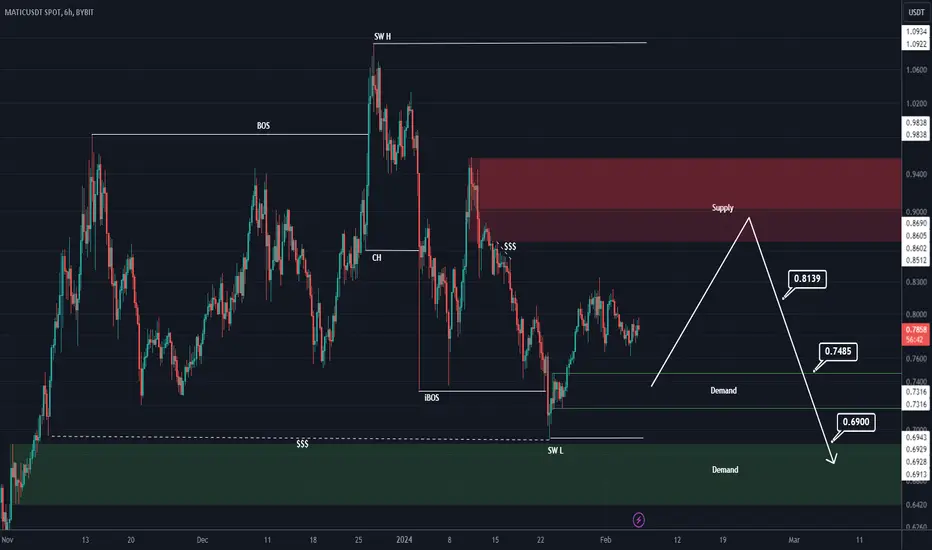
Matic analysis (4H)We have an important supply on the MATIC chart that may cause a drop or change the trend.
We have the change of structure with bearish CH on the chart and we also have supplies that have been mitigated and have moved sell orders to lower ranges with lower H and L.
In case of rejection from Supply, we have specified the targets and
For risk management, please don't forget stop loss and capital management
Comment if you have any questions
Thank You
MATIC ANALYSIS🔮 #MATIC Analysis 💰💰
🌟🚀 #MATIC is trading in a Symmetrical Triangle Pattern. The price is currently trading in a small zone below its descending trendline and a good bullish moment will be confirmed after a good breakout. 🚀🚀
🔖 Current Price: $0.7880
⏳️ Target Price: $1.5072
⁉️ What to do?
- We have marked some crucial levels in the chart. We can trade according to the chart and make some profits in #MATIC. 🚀💸
🏷Remember, the crypto market is dynamic in nature and changes rapidly, so always use stop loss and take proper knowledge before investments.
#MATIC #Cryptocurrency #DYOR

MATIC - 4H - $0,95 - 20% profit possibleMATIC is holding support at current level and can make a bounce up back to $0,95 which is a profit of approx. 20%.

Bullish on Matic Swing LongI am too Buliish on this having alot in spot bags avg buy around 0.68
Longed it here with tight sl from 0.7980.
Stoploss at 7850.
Possibly it can hold here if hold here means reclaimed the trendline and this can Quick sent to 1.2 initially.
The real bull run on this will begin after 1.
HTF currently looks too Bullish.
Note: Not a Financial Advice.

MATIC → Polygon Pullback then Bounce to New Highs? Let's Answer.MATIC has been caught between a trading zone since November but has finally touched the Support Zone and bounced back above the Daily 200EMA. Should we long here?
How do we trade this? 🤔
The Support Zone was touched and a strong bounce led the price back above the 200EMA. We are currently hovering between the Daily 30EMA and 200EMA with no clear signals to buy or sell. The RSI is around 46.00 and above the Moving Average, another sign for a long position. The only thing we're missing is a solid Risk/Reward Ratio and a buy signal, which requires the price pullback a bit more before we can enter the market.
We ought to target at least a 1:2 Risk/Reward, but I believe we have the runway for a 1:3 Risk/Reward given the distance to the previous high of $1.092. Target the $0.735 price area for an entry and place a stop loss below the previous low in the Support Zone around $0.655, the first Take Profit at $0.815, and the final Take Profit around $0.975 or until you see a sell signal. Move the stop loss up to the entry price when Take Profit #1 is hit to lock in profits.
The first take profit is placed around the 30EMA zone since it may act as resistance. The second take profit is placed just before $1.00 where there has been a few failed attempts to break it since November.
💡 Trade Idea 💡
Long Entry: $0.735
🟥 Stop Loss: $0.655
✅ Take Profit #1: $0.815
✅ Take Profit #2: $0.975
⚖️ Risk/Reward Ratio: 1:3
🔑 Key Takeaways 🔑
1. Trading range after a bull run justified long bias.
2. Contact with the Support Zone followed by a bounce.
3. Price hovering between 30EMA and 200EMA, wait for pullback.
4. Look for long entry around $0.735 for a 1:3 Risk/Reward ratio.
5. RSI at 46.00 and above the moving average, supports long bias.
💰 Trading Tip 💰
It's reasonable to take half profits at the first resistance target in a long trade, or the first support target in a short trade. Using a 1:1 Risk/Reward Ratio for your first target, you can move your stop loss up to your entry price, locking in profits. This allows you to watch the rest of the trade execute without worry of losing money. This helps improve trading psychology and the equity in your account.
⚠️ Risk Warning! ⚠️
Past performance is not necessarily indicative of future results. You are solely responsible for your trades. Trade at your own risk!
Like 👍 and Follow to learn more about:
1. Reading Price Action
2. Chart Analysis
3. Trade Management
4. Trading Psychology

$MATIC Tripple bottom Head & Shoulders Reversal CRYPTOCAP:MATIC Polygon is retesting a breakout above the downward channel since December. It appears the recent low of $.7650 is a potential higher low from the bottom at $.69. The next level to test as support is $.7777. Then CRYPTOCAP:MATIC needs to get above $.8056 to continue it's breakout to $.88, $.93, $1.00+++
Do your own research. Just ideas.

MATIC ANALYSIS🔮 #MATIC Analysis - Breakout 🚀🚀
💲💲 There is a breakout of Falling Wedge Pattern in #MATIC and trying to retests the level. It's a 4hr time frame breakout and we can see more higher price in long-term. If the price closes above the major support then there will be a confirmation of bullish movement 📈📈
💸Current Price -- $0.7892
📈Target Price -- $1.0597
⁉️ What to do?
- We have marked crucial levels in the chart . We can trade according to the chart and make some profits. 🚀💸
🏷Remember, the crypto market is dynamic in nature and changes rapidly, so always use stop loss and take proper knowledge before investments.
#MATIC #Cryptocurrency #Breakout #DYOR

MATIC - FEBRUARY, MARCHIf we take the liquidity from the bottom of the sideways movement and return to it back. Then we can safely expect a goal of $1.
As you can see, we have broken the structure on the 1-day timeframe. Therefore, I still expect a more red scenario where I can safely go long.

MATIC - FEBRUARYAt the moment, I am considering 2 scenarios.
1) If we take the liquidity from the bottom of the sideways movement and return to it back. Then we can safely expect a goal of $1.
2) From the current value, we will immediately go to the upper limit, then at least you can set a stop loss in a safe zone and wait for the denouement at the upper border of the sidewall.

MATIC LONGMATIC LONG, Matic just broke a major trend and made a double bottom showing signs of strength

MATICUSDT IDEA 4H#Matic is on the verge of another breakout, forming a falling wedge and gearing up for a substantial bullish rally. In case of a successful breakout, there's an expectation of a 45-50% bullish wave, targeting $1.50✍️

MATIC/USDT Breaking the upwards bullishafter breaking the upwards bullish channel and forming a market structre shift, price went up to the 62% febo retracment level. Expecting a distribution range here before expanding lower to the support levels.
(FROM THE LOW TO THE HIGH WE DIDNT RICH THE 50% FIBO YET )

MATICUSDT potential falling wedgeHi traders,
Let"s take a look at MATIC chart on the 4 hours time frame. It is likely that the price is forming the falling wedge pattern. We expect the price to break out of the pattern. Long position can be taken after the successful breakout. Look for the volume increase in order to avoid trading the false breakout.

MATIC/USDT Could MATIC back to break resist or back to demand ?💎 MATIC has recently experienced significant developments in the market. Currently, MATIC has displayed strength by bouncing from the demand area, which previously acted as a supply zone. Moreover, it has successfully broken out of a descending channel pattern.
💎 If this breakout is valid, there is potential for MATIC to continue its upward trajectory and attempt to break through the resistance area. Breaking this resistance is essential because a successful breakout, probability could pave the way for MATIC to reach our target at the Bearish OB area.
💎 However, if MATIC fails to sustain its upward momentum and experiences a false breakout, there is the possibility that the price will retreat to the demand area to establish a new bullish momentum.
💎 The demand area holds significant importance, as a breakdown from this level could signal a return to bearish sentiment, potentially driving the price back towards the strong support area.

MATIC longMATIC bounced off the lower boundary of ascending channel. Bullish movement to resistance level at 0.833 is possible.

Matic - Bullish Momentum BuildingPolygon (MATIC) has been trading within a horizontal accumulation pattern on the daily timeframe, attempting a breakout previously but lacking the strength to sustain higher levels. The recent breakout from the lower boundary of the accumulation range provides a renewed sense of strength, positioning MATIC for potential upward momentum. Additionally, on the hourly timeframe, the continuous confirmation of bullish intentions through bear traps contributes to the positive outlook.
🔄 Daily Accumulation and Breakout:
MATIC's extended consolidation within the daily accumulation pattern signaled a period of indecision and potential accumulation of positions. Previous attempts to break out to the upside were met with challenges, preventing sustained upward movement. However, the recent breakout from the lower boundary suggests a shift in dynamics, providing the necessary strength for potential growth.
🚀 Strength from Breakout:
The breakout from the lower boundary of the accumulation range grants MATIC a significant boost in terms of potential upward momentum. Successfully establishing a higher trading range could indicate a newfound market sentiment favoring bullish movements.
🔍 Hourly Confirmations and Bear Traps:
On the hourly timeframe, MATIC exhibits a pattern of continuously confirming its bullish intentions. The creation of bear traps, strategically inducing short-term downward movements, adds to the overall bullish narrative. These traps serve to shake out weak hands and provide additional fuel for faster growth.
💡 Trading Strategy:
Traders and investors may consider positioning themselves strategically in MATIC following the breakout from the accumulation range. Confirmations on the hourly timeframe, especially through the use of bear traps, can contribute to the overall bullish case. Implementing effective risk management strategies, such as setting stop-loss orders, is advisable.
🔮 Future Outlook:
The technical analysis suggests that MATIC is well-positioned for potential growth following the breakout from the accumulation range. Traders should remain vigilant and adapt their strategies based on real-time market data. The combination of the daily breakout and hourly confirmations, including bear traps, creates a favorable environment for bullish momentum. The cryptocurrency market's dynamic nature emphasizes the importance of flexibility and risk management in trading decisions.

MATICUSDTMATICUSDT was trading in descending parallel channel. The price was reacting well the support and resistance of channel.
Currently the price has given the breakout of triangle and now retesting the broken level where it is also forming a local support zone and seems like the price may go for another leg higher.
If the breakout sustain to upside the optimum target could be 1.00
What you guys think of this idea?
