MATIC - Probably Nothing...#MATIC
As noted before, the rocket fuel has now been loaded at the LPS (Last Point of Supply).
Now it's time, Number go up...
MATICUSDT.P trade ideas

MAEIC short zon Hello friends, we have the Metic currency that has reached its supply area, according to the trend of Bitcoin, we can enter after Tide.


$MATIC in Conflict With 100WMA to Start a New Uptrend Hi everyone,
We are in the CRYPTOCAP:MATIC weekly chart and as you can see, CRYPTOCAP:MATIC has fluctuated in a beautiful Symmetrical Triangle since registering a new ATH. Also, during recent weeks, CRYPTOCAP:MATIC has been engaged in consolidation, which has caused it to register some lower highs in this triangle and convince us that it will soon exit from the upper side of this triangle.
In the lower part of the chart, we can see that CRYPTOCAP:MATIC has formed a strong support area in the range of 50 cents. Currently, the 100WMA resistance is considered as the only factor preventing CRYPTOCAP:MATIC from exiting this triangle. If CRYPTOCAP:MATIC can cross the 100WMA barrier, it will simultaneously exit this boring triangle and start a new uptrend.
But if CRYPTOCAP:MATIC cannot cross the 100WMA barrier for any reason, then we will see it fall back to the bottom of the triangle and record some higher lows. Anyway we will wait for the next events of the crypto market and confirmation of the trend.
As always this is not a financial advice & please do your own research.
"Like" & "Follow" if you want to see more of these ideas.
Goodluck

Matic is just preparing.Matic is holding resistance zone around 0.94-0.97 area, which means closing candle above is a great opportunity to look for long position. And here is my idea of how it will go. I will be taking profits at those green lines.

The Huge Potential in front of Matic(Polygon)Matic has been forming a large triangle formation since April '21. If the price breaks this triangle Polygon will start a 1000% rise. Potantial price target will be at $12-13. In the last decline price rose again without touching the lover band of the triangle. This movement of the price is an argument that strengthens the bullish theory. Polygon is a rapidly developing project. I think that price target is quite possible for this project, which frequently announces new agreements.
This publishment is not an investment advice, do your own reasource.

MATIC - Potential Bullflag breakoutHere we see Matic trying to break out of its bullflag (green lines). A daily candle close above the resistance line would cause a breakout to $0.98 once the 0.786 is closed above. Then our target would be $1.14 (1.618) and a potential bullflag target of around $1.50 if the flagpole extrapolation is reached.

MATICUSDT -BEARISH AB=CD TREND MATICUSDT is now testing point B where is the confirmation of the trend and at point D is the reversal trend
MATIC/USDT | 1d 👀1. MATIC is gaining momentum, signaling a bullish trend.
2. The coin is in a bullish pennant pattern on the 1D chart, likely to break out within the coming weeks.
✅ Stay updated on market news and developments that may influence the price of Polygon. Positive or negative news can significantly impact the cryptocurrency's value.
✅ Exercise patience and discipline when executing your trading plan. Avoid making impulsive decisions driven by emotions, and adhere to your strategy even during periods of market volatility.
✅ Remember that trading always involves risk, and there are no guarantees of profit. Conduct thorough research, analyze market conditions, and be prepared for various scenarios. Trade only with funds you can afford to lose and avoid excessive risk-taking.
#Crypto #Polygon #Trading #MATIC

MATIC - Wyckoff SOS + LPS Before Blast Off#MATIC
Textbook Wyckoff Accumulation Schematics, with ideal volume profiles, showing the standard "Sign of Strength" (SOS) Flag while absorbing all the fear sales into one "Last Point of Supply" (LPS) before go time.
Hope this helps...

MATIC Bearish Flag H1, Good time to SHORTMATIC Bearish Flag H1, Good time to SHORT.
BTC seem a bit retrace soon 1st week 2024

MATIC/USDTCRYPTOCAP:MATIC is looking good in a daily chart, after flipping the zone in red take an entry and then enjoy. Always use stop-loss. Everything is on the chart

MATICUSDTMATIC analysis of the 4-hour time form
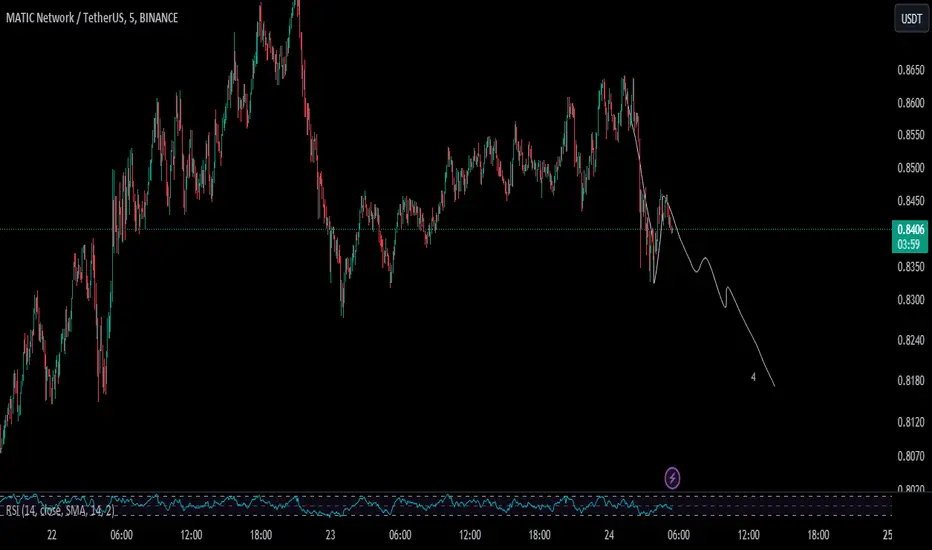
The price of Metic is now 0.846 dollars. The upcoming support (0.822) is important because the largest volume of this interval is in this area, and in case of support at the price of 0.822 dollars, target 1 is likely to be hit, and if the next resistance is broken, target 2 will be touched.
The drawn black trend line is the next resistance, which is of great importance. If it is broken upwards, we will see the third target as well.
Our key support is the pink box drawn below, which is the same as our Fibomachi 50. As this area is lost, the possibility of a downward trend change increases.
Technical analyst: Amirhasan Salek

Matic analysisThe analysis of the matic currency in the short term... here it can return to 0.90 by touching the range of 0.82 and finally the target will rise up to 1 dollar in the coming days.

MATICUSDT SHORT TRADE IDEA 24-12-2023MATICUSDT is printing a Bearish Flag, break a structure then short and Take profit when u satisfied.


Ascending PositionMATIC, positioned at the top of the Fibonacci 0 zone, indicates a potentially strong base for growth, particularly if Bitcoin's price rises.
This correlation with Bitcoin's movement implies that a positive trend in Bitcoin could significantly benefit MATIC.
This analysis is for informational purposes only and should not be considered as financial advice.

📊#MATIC may continue to rise based on the smiley structure🚀According to the Elliott Pulse Wave, we stopped in the 12h buy zone after completing the 5th wave, and formed a smiling face bullish structure in the buy zone, so we are very likely to use this structure to change the downward trend.
Let’s see 👀
🤜If you like my analysis, please like 💖and share it💬
💕 Follow me so you don't miss out on any signals and analyze 💯

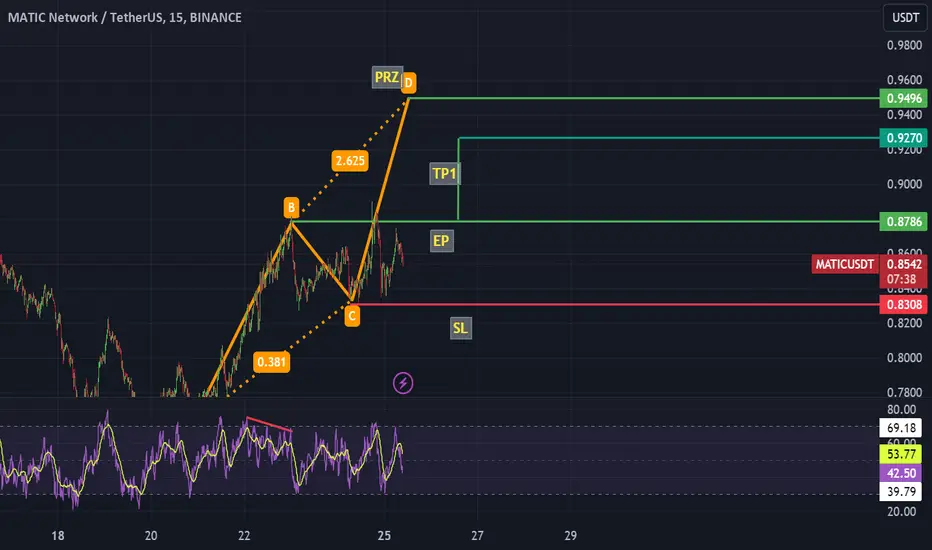
MATIC → Ascending Triangle Breakout? Or Rejection to $0.60?MATIC (Polygon) is at a pivotal moment on the chart; follow-through with the Ascending Triangle and breakout to the upside? Or get rejected a third time and fall back toward the $0.60 level?
How do we trade this? 🤔
To justify a long, we need to break the Resistance Zone and test it for support. We're too close to Resistance to long now, the probability of profit is far too low and the stop loss would have to be placed too far away (bad Risk/Reward). After breaking the Resistance Zone, a protective stop should be placed just below it and a Take Profit at 1:2 Risk/Reward is reasonable.
A short position could be available much sooner if the price is rejected a third time at the resistance zone and falls beneath the Daily 30EMA. What we need is a sell signal bar and confirmation closing on or near their lows, below the 30EMA, and the RSI below the Moving Average.
Until either scenario presents itself, we should remain on the sidelines and watch the price action unfold.
💡 Trade Ideas 💡
Short Entry: $0.885
🟥 Stop Loss: $0.955
✅ Take Profit: $0.755
⚖️ Risk/Reward Ratio: 1:2
Long Entry: $1.017
🟥 Stop Loss: $0.937
✅ Take Profit: $1.177
⚖️ Risk/Reward Ratio: 1:2
🔑 Key Takeaways 🔑
1. Ascending Triangle, Bullish Pattern!
2. Strong Support on Daily 30EMA.
3. At Resistance Zone, Do Not Long Here!
4. RSI at 53.00 and Below Moving Average. Bias to Short.
5. Wait for break of resistance zone to Long. Short if Rejected.
⚠️ Risk Warning! ⚠️
Past performance is not necessarily indicative of future results. You are solely responsible for your trades. Trade at your own risk!
Like 👍 and comment if you found this analysis useful!

MATIC/USDT is currently trading within the medium range.MATIC/USDT is currently trading within a medium range. You can make your own decision by analyzing its chart patterns.
DYOR.

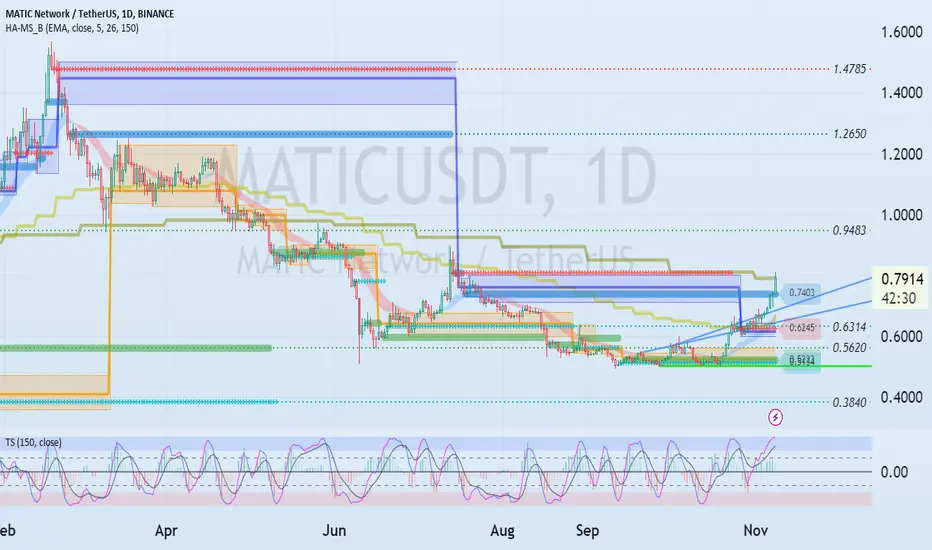
Uptrend turning point : 0.9483Hello traders!
If you "Follow" us, you can always get new information quickly.
Please also click “Boost”.
Have a good day.
-------------------------------------
(MATICUSDT chart)
(1M charts)
Since it has not yet risen above the MS-Signal indicator, it is difficult to say that it has turned into an upward trend.
Accordingly, the key is whether it can rise above 0.9279.
(1W chart)
The key is whether the price can be maintained above 0.7529 and rise above 0.9391.
(1D chart)
Looking at the overall picture, I think the range from 0.3840-0.5620 to 0.9483 is an important support and resistance range.
Accordingly, the direction in which one deviates from this section is important.
This is the current 1M chart's M-Signal indicator touched.
Therefore, the key is whether it can rise above the M-Signal indicator on the 1M chart and rise above 0.9483.
If this is not the case and it falls below 0.7403, there is a possibility that it may fall to around 0.6314, so you need to think about a response plan.
If the price rises above 0.9483 and holds, it is expected to turn into an upward trend.
--------------------------------------------------
- The big picture
The full-fledged upward trend is expected to begin when the price rises above 29K.
This is the section expected to be touched in the next bull market, 81K-95K.
-------------------------------------------------- -------------------------------------------
** All explanations are for reference only and do not guarantee profit or loss in investment.
** Trading volume is displayed as a candle body based on 10EMA.
How to display (in order from darkest to darkest)
More than 3 times the trading volume of 10EMA > 2.5 times > 2.0 times > 1.25 times > Trading volume below 10EMA
** Even if you know other people’s know-how, it takes a considerable amount of time to make it your own.
** This chart was created using my know-how.
---------------------------------