Matic A perfect pennantThis is one of the nicest charts in crypto. right now as of today we had a pull back on the 4 hour/Daily so its a great time to get in if you havent already
MATICUSDT.P trade ideas

Nice price for enter in Matic.Polygon (MATIC) is one of my favourite coins. I like their project and their platform with a lot of dApps. Price is now in good entry zone for those who would like to buy it. This is trade (investment) setup on larger timeframe. I am not looking to reach targets 2,3,4 and 5 very soon, that could be year(s). I will sell most of my capital on targets 3,4 and 5. Small portion will be sold on Targets 1 and 2.
Entry Zone: 0.70 – 1.05
Buy Zone:0.23 – 0.35
Target 1: 1.64 – 1.78 (55%)
Target 2: 2.75 – 2.89 (159%)
Target 3: 3.53 – 3.76 (234%)
Target 4: 4.62 – 4.91 (335%)
Target 5: 6.40 – 6.63 (504%)

Matics butterfly seems apparentOnly time will tell, but MATIC is on a very obvious butterfly ride over the years.... all be it, you might have to hold on till 2025.

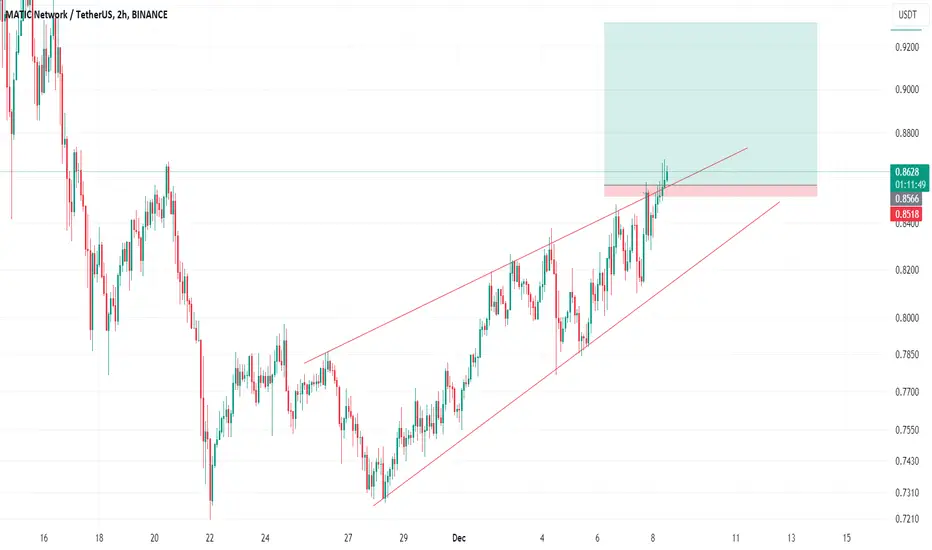
SasanSeifi 💁♂ A Price Analysis of the 4-Hour TimeframeAs you can see in the 4-hour timeframe, the price has been in an uptrend from the demand zone at 0.73. It broke through the HIGH at 0.79 and grew by approximately 14% to the price range of 0.83. After the growth, the trend is currently range-bound in the price range of 0.80. In the 4-hour timeframe, it is very important to maintain the support levels of 0.80/0.79 cents for the continuation of the bullish trend of the symbol.
The expectation that we can consider in the 4-hour timeframe is that, if the support levels are maintained, we will see the price grow to the liquidity range of 0.87. Then, after a partial correction and pullback, it will again be accompanied by further growth up to the supply area and the bearish order block of the price ranges of 0.90 cents and 1 dollar. The possible trend is also shown in the above image. In the event of positive fluctuations, it will be important to see how the price reacts to the liquidity range of 0.87 cents to better understand the continuation of the movement.
🔵Remember, always conduct your analysis and consider other factors before
making any trading decisions. Good luck!"✌️
❎ (DYOR)...⚠️⚜️
Sure, if you have any more questions or need further clarification, feel free to ask. I'm here to help!
if you found my analysis helpful, I would appreciate it if you could show your support by liking and commenting. Thank you!🙌✌

✴️ Polygon Massive Bullish Explosion Within Hours?!➖ The daily session is at a multi-months high;
➖ The trading volume is favoring the bulls;
➖ The consolidation phase is long gone, over;
➖ The indicators are all trending up;
👉 Polygon (MATICUSDT), is ready for a massive bullish explosion!
After the minor peak 24-Oct prices remain trading above EMA10, which means no correction.
As MATICUSDT continues to challenge resistance with bullish volume going up, we can expect a major break to happen, the strongest move we've seen since January but stronger when all is set and done.
This is just a friendly reminder as I already shared many charts for this pair.
I hope you won't stay behind... Time is running out!
Thank you for reading.
Namaste.

✴️ Polygon | The Good News About Low VolumePolygon (MATICUSDT) can be seen ultra-bullish but, Where is all this bullishness coming from?
This week we are at the 4th session green, with each week hitting new highs.
Each week is full green with EMA21 and EMA10 having been conquered as resistance, the bulls clearly have the upper hand.
The RSI, blah, blah, blah...
Let's get to the interesting part!
Hold on, the volume signal first.
Trading volume is relatively low and we don't have a high volume week that reveals what is coming next.
In this type of scenario the low volume indicates that there is no selling pressure.
It indicates that the real action is yet to happen.
Since we have really strong bullish signals with the candles, higher lows, moving averages and RSI, the volume becomes secondary and actually reveal that there is still so much potential for additional growth.
Where does all the bullishness come from?
We use these charts to predict the future.
Obviously, the charts do not predict the future nor reveal anything about it, the chart is the past but we can use this information to reach certain conclusions.
Bullish actually means bad, in some cases, in some ways.
Bullish can actually mean low prices, crash, bad news, etc.
This is important because it is really basic and I see many people are still confused.
It would be a great upgrade for your charting, your sharing.
When we use the word "bullish", we are referring to future potential growth mainly.
So, bullish at the bottom, bearish at the top.
The indicators can be read in many ways... Here is one that is easy and everybody can agree and understand.
An RSI reading say of 18 is considered weak but instead we call it "oversold" and we use this "oversold" signal to understand "buy" or potential for higher soon based on this reading.
On the contrary, when the RSI is really high, say 80, it is considered super strong.
But this is tricky, it can work great if we take the broader market into context but at one point a "strong", "bullish" RSI reading can be considered overbought, signaling a bearish potential.
All the bullishness comes from the fact that MATICUSDT was trading near support, produced a reversal pattern and started to go up... While the technical signals can be read as bearish, we use the charts to better understand these signals and know that while technically bearish, the potential is up.
So we say bullish when prices are down and bearish when everything is up (based on the correct interpretation of the chart signals of course).
Thank you for reading.
I hope you are being entertained.
All the information is shared here for educational purposes, 100% FREE... You just need to comeback if you enjoy it to show your support.
You are appreciated.
Be blessed!
Namaste.

21 moves with $300 positionHi,
I've been employing a strategy involving 21 moves, each with a $300 position, and at every 0.0200 position, it yields $6-7 USDT. I adopted this approach following a loss in December 2022, and within six months, I successfully recovered the $3,000 deficit through this secure investment plan.

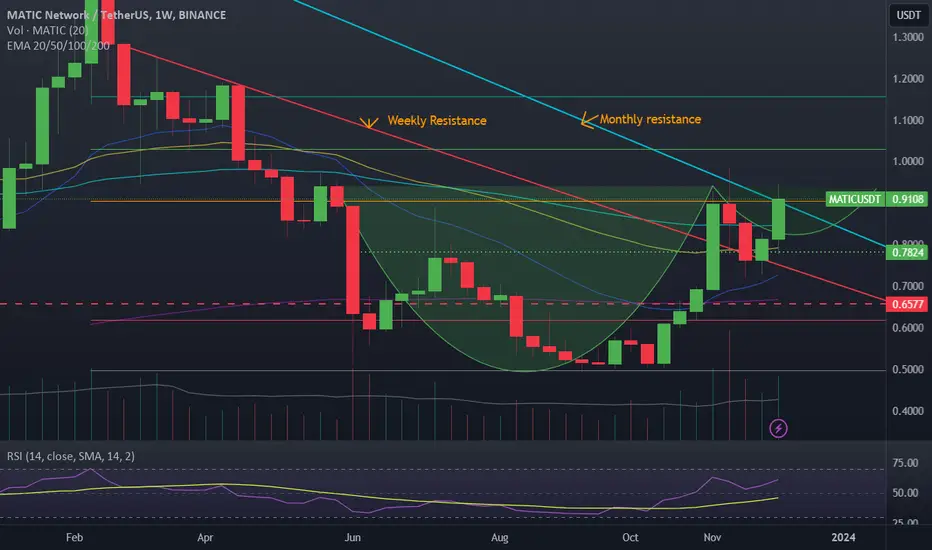
MATICUSDTMATIC analysis of the daily time form
The price is currently $0.899. According to the yellow trend line and the reaction of the price to this area, it is expected that this resistance will be broken and targets 1, 2 and 3 will be hit after passing the SUPPLY area. Pay attention to the green support lines. If the support is broken, it may reach the Fibo level of 618. This support level is very important.
#MATICUSDT

long crypto Maticits clearly working i guess. in previous post i have suggested matic to make a trade of long. from 0.9321 it has corrected to 0.90~0.91. now it might go upto 1.10 and 1.20$ range in soon time. its clearly in a perfect channel at 4 hr channel. as well as it supports 1hr moving average of 50~200. i have longed 5000 matic @ 0.91. lets see, what do we get in this trade.

Last update MaticMatic now is around 0.90$ we will see it soon around 0.92€ you can buy cosy. Ps any goes down it will be a good opportunity to buy more

MATICUSDT BULLISHMatic has started pumping and reached at our 1st , we have secured our profit and wait can matic usdt will go up more? Yes! it will and we still can buy

Update on Matic potential breakoutMatic has had a rough time these past few weeks and is testing the monthly resistance again. This could form an irregular handle and blast over 1$ soon. We could see as high as 1.4$ by christmas if BTC behaves. I have held this token long-term staked and added on the multi-week reversal we recently saw.
crypto long on maticits an bullish trend in overall crypto market. so, as of i have seen trends in some altcoin. matic is one of the best that we can bet on. i have longed it from 0.89. in some days it might reach 1.2$. in technicals also it is in an upward channel. and from support it is going towards resistence which is somewhere around 1.2$. so it is definately a call sign and will get a profit of roughly around 30% sharp.

📊#MATIC may continue higher, cautious shorting⚠️➡️Remember we shorted MATIC before?
🧠At that time we had locked in major profits after completing a full Elliott Pulse, and our risk-free expectation was that it would continue down to the ideal target zone of the Smiley Face bearish structure. But over time we developed a double top bullish structure at the bottom, so we gave up on the ideal target of the smiley face bearish structure very early.
➡️And in the subsequent development, my conjecture was further confirmed. Then I noticed that we were once again following the Elliott Pulse wave move, and when we were running Wave 3, I started setting up a long trap and was delighted that the market developed as expected, a very beautifully set up. We are currently completing wave 5. It is expected that we will most likely sweep the liquidity pool above and then start to fall back. Whether it can continue to go higher, we still need to continue to observe.👀
🔥Congratulations to all the friends who followed us to print money🎉💰🍻I have helped everyone make money, so I hope you can also help me. Please remember to like❤️share my analysis posts and channels. 📤

lets play again POLY MATiiiiiMATIC/usdt 4h tmf shows long to 0.9-0.94
lets see what will happen for it
be aware this is not a signal for buy/sell orders its just an idea.
please search yourself and have the best.
wish you all the best.

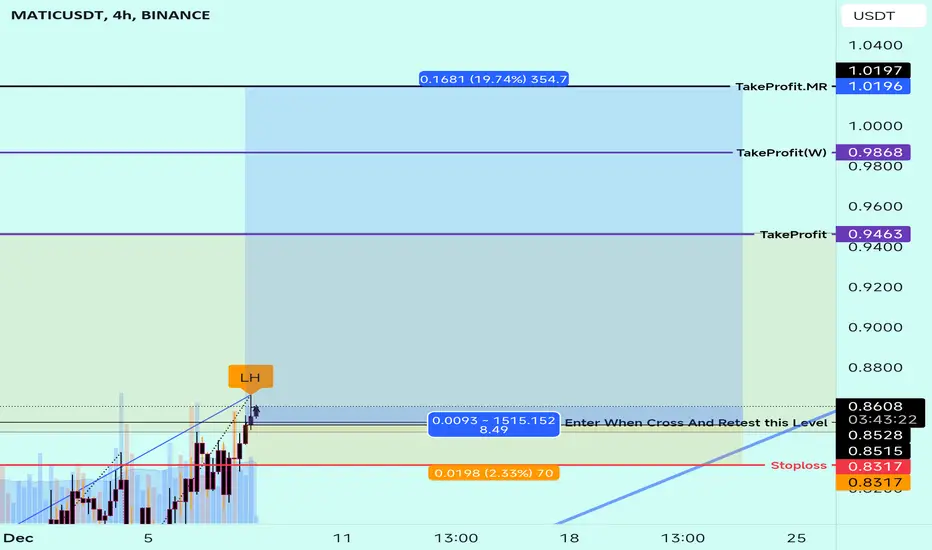
MATIC/USDT 4HInterval CHARTI invite you to review the MATIC chart taking into account the four-hour interval. As we can see, the price has broken the downtrend lines, but currently we can see the price climbing the local upward trend.
Looking at the current growth, using Fib Retracement we will determine the places of further resistance that the price must face. And here you can see that we have gone above the resistance at the level of 0.618FIB, and are approaching a strong resistance zone from $0.93 to $0.98, when the price breaks above the resistance and positively tests it, we can see a move to around 1, $15.
Looking the other way, there is support at $0.84, then we have a second support around $0.79, and then there is a support zone from $0.76 to $0.72.
The CHOP index indicates that the energy is currently used for an upward movement, the RSI indicator is approaching the upper limit, but there is still room for a larger move, while the STOCH indicator is moving above the upper limit, which may limit the price increase in the coming time.

#MATIC +20% PROFIT IN ONE WEEK#MATIC Falling Wedge formation on the 4h TimeFrame Chart.
In case f breakout, Expecting up to +20% Bullish rally in Short Term

LDO vs MATIC 3day ChartLDO and MATIC here, as you can see on MATIC, when 200MAs formed it went parabolic (14,000%)
History doesn't always repeat, but it does rhyme. LDO should moon eventually, maybe after BTC halving.
These moving averages will form in about 20 days. If they form under price, in theory, it should be bullish. Also, it is possible for price to get pulled into these newly formed moving averages and then spring off of them. Notice it happened on MATIC.
I don't want to miss the LDO train when it leaves the station. I will probably acc. from here and dip down into the 3day white 100 if we get that.
Thanks for your time. Please follow here for more!

1 H SHORT MATICGreetings, traders. Recent market trends have seen a notable upswing in Bitcoin. The Relative Strength Index (RSI) for Matic is signaling a potential -5% correction in the near future. From my analysis, this presents an opportune moment to initiate a SHORT position, capitalizing on the anticipated downturn and securing profits at the -5% threshold.
Starting
SHORT 0.88

Matic we Are Ready for 2nd Entry**Short Overview**
Matic (MATIC) is the native cryptocurrency of Polygon, a layer-two scaling solution for the Ethereum blockchain. It serves as a transactional token for paying fees on the Polygon network, as well as a governance token for voting on network proposals. Polygon aims to improve the scalability and usability of Ethereum by enabling the creation of low-cost, high-speed dApps.
**Fundamental Analysis**
* **Scalability:** Polygon's sidechain architecture allows it to handle a significantly higher volume of transactions than the Ethereum mainchain. This makes it a more attractive platform for developers building dApps that require high throughput.
* **Cost-effectiveness:** Polygon's transaction fees are significantly lower than those on the Ethereum mainchain. This makes it more affordable for users to interact with dApps on the Polygon network.
* **Developer adoption:** Polygon has a growing ecosystem of dApps and projects, and it is attracting a large number of developers. This suggests that it is a viable platform for building blockchain applications.
**Recent News**
* **Polygon SDK 5.0 released:** The latest version of the Polygon SDK includes several new features, such as support for zero-knowledge proofs and improved scalability.
* **NFT marketplaces Polygon Studios and OpenSea partner:** The partnership will allow OpenSea users to mint, buy, and sell NFTs on Polygon.
* **Polygon Integrates Chainlink oracles:** Chainlink oracles will provide secure and reliable data feeds to dApps on the Polygon network.
**Disclaimer**
Please note that the cryptocurrency market is volatile and risky. There is no guarantee that MATIC will increase in value. Before investing in any cryptocurrency, it is important to carefully research the project and understand the risks involved.
Matic short ⏰ period analysis 📌Completely ⚡ short period analysis based on Trend support and supply and demand
With movement shift // pls #DYOR
👉 I am expecting COINBASE:MATICUSD shifted 🙄 it's movement bullish side 😛 in day frame LL >> HL
Use 1% position size of ur liquid 💰
Leverage must be below 4X cross 🤞
⏰ expecting 30-50 day's below later invalid 📌
🔥Buy :: $0.5 - $0.54 < split liquid 💰 60% - 40% >
🎯 :: $0.6238 - $0.6475 < move stop lose to entry or profit >
🎯 :: $0.7280 - $0.7575 < 💯% exit >
Stop 🚏 lose < #SL > ::- $0.4804

MATIC/USDT Anticipating a Breakthrough Above Resistance? 👀 🚀 💎 Paradisers, focus on #MATICUSDT as it's showcasing a promising market behavior. Following a rejection at resistance, it is now regaining strength in a demand zone, preparing for another shot at breaking through the resistance, with a bullish move highly anticipated post-breakout.
💎 Reflecting on #MATIC past performance, it has shown a consistent pattern of following a descending trendline before breaking above to initiate an upward trend. Currently, it is maintaining strong momentum, signaling an equal low trajectory and gearing up for a potentially robust bullish move. If this upward momentum is sustained, #MATIC could be eyeing higher resistance levels at $.9819 and $1.2425.
💎 However, in the dynamic and often unpredictable world of cryptocurrency trading, #Polygon traders must stay prepared for various scenarios. If the present breakout effort doesn’t gain the expected traction, a prudent fallback strategy would involve preparing for a bullish recovery from the demand level of $0.7722. 🌴💰
