CRUDEOIL Buy Setup 3 hrs TGT with in a 3 daysSuper valid-looking! Leave a comment if you like my entry setup. This share is for educational learning purposes only, and I am not responsible for your profit or loss. Note: For more details, check the chart."
CRUDEOILG2023 trade ideas
Crude Steps and Forces- all rectangles are potential support/resistance with the last one blue being a probable exception
- the 3 marked with dots levels can also become support/resistance, especially the first bottom blueish one, but they can also become like milestones levels or steps in the evolution of the price
- the 2 green curves are also potential support/resistance acting as forces pushing the price up or down
This snapshot considers the bullish scenario where the price remains above 66, with potential reversal patterns to occur near the red rectangle zone.


Can the HOUSE CAPITALIZE Long above $80.00 Per Barrel...?NYMEX:CL1!
"If you train hard, you'll not only be hard, you'll be hard to beat." -Herschel Walker
Oil has been struggling to Break above $80.00 Per Barrel roughly this whole month of MAY and this week we could actually see buyers gain strength and get over the hump... However that is a long shot prediction! Now if this actually does come to pass then this is what I'll need to see in order to go LONG...
1) Price is currently trading around a 4Hr Supply Zone. ** I want to see buyers push price up N break the supply zone and continue towards the HTF S&R Zone....
2) We have a HTF Descending eR/LQ Trendline that I want to Buyers Breakout N push towards $80.00 Per Barrel... I would like to see a retest of the Failed 4Hr Supply Zone and eR/LQ trendline for buyers to gain more strength for pushing towards our target...
3) Now if we can get the sequence of events to take place that I stated above, Then we will wait for the break above $80.00 Per barrel with confirmed candle closures above price and above the S&R Zone... I want to see confirmed candle closures on the 30m TF N Below to establish conviction in the move from buyers to enter LONG....
4) Now if we can get the Break above $80.00 Per barrel with confirmed candle closures above price and above the S&R Zone then I'll Enter LONG and Target the break of the 4Hr Supply Zone price ($81.10 Per Barrel) 110 pts to be exact in our favor... Ill set my stop just below the S&R Zone EQ Level giving me roughly around a 2.7RR....
Remember when it comes to FRM (Financial Risk Management) our job is to manage the downside costs of printing High side returns of $$$ consistently... Let's Step!!
Stay Focused & Reach Excellence!!
#BHM500K #NewERA #Champions

Crude Oil, Not Out of the Woods YetThe chart above references continuous (front-month) Crude Oil, below we are discussing the July contract.
Crude Oil (July)
Yesterday’s close: Settled 79.83, up 2.11
WTI Crude Oil futures cleared the psychological $80 mark, but can it settle above? A major catalyst to start the week was strong travel demand data from the U.S. over the Memorial Day weekend and from China of late. We also believe geopolitical tailwinds are more relevant than headlines may give credit at the moment. Ultimately, weakness last week came on the heels of the White House announcing a release of Gasoline reserves ahead of the weekend and this was quickly shaken off and further helped create a technical bottom at a critical area of support we have been highlighting.
Still, price action is not in the clear, and we find it a good time to monetize some of this move at least if you’ve been able to capitalize as it is testing major three-star resistance at 81.15-81.28, aligning a gap with the 50% retracement back to the April 12th high. Additionally, the 50-day moving average comes in at 80.84.
Bias: Bullish/Neutral
Resistance: 81.15-81.28***, 82.03-82.34***
Pivot: 79.97-80.11***
Support: 79.46-79.61**, 79.01-79.05*, 78.66-78.78***, 77.72-78.05***
*Trade ideas cited above are for illustration only, as an integral part of a case study to demonstrate the fundamental concepts in risk management under the market scenarios being discussed. They shall not be construed as investment recommendations or advice. Nor are they used to promote any specific products, or services.
Futures trading involves substantial risk of loss and may not be suitable for all investors. Trading advice is based on information taken from trade and statistical services and other sources Blue Line Futures, LLC believes are reliable. We do not guarantee that such information is accurate or complete and it should not be relied upon as such. Trading advice reflects our good faith judgment at a specific time and is subject to change without notice. There is no guarantee that the advice we give will result in profitable trades. All trading decisions will be made by the account holder. Past performance is not necessarily indicative of future results.

Wednesday Forecast Crude OilWe had a very expansive two days From the Bank Holiday Monday and Tuesday.
I do expect the market to slow down a little before we start to move higher to 81.50 as long as price stays above the 1hr fvg and the 1hr +ob my bias will be Bullish.
If we close bellow these pd arrays then a retracement is in order and different targets will have to be looked at.
Pretty simple

Oil - BUY
Out of Bounds
FTLMA Bands at bottom band
Retrace Over Extended
Double Bounce on Support
Aggressive Entry
Passive Entry
After pull back into Fair Value Gap + Continuation
Nice Order Block Below
Has been pushing down all week really
Could well be heading for that
Lets See : )

A Bottom In Crude Oil?Crude Oil (July)
Yesterday’s close: Settled 77.57, down 1.09
WTI Crude Oil futures are showing renewed life this morning, trading nearly 2% from the low through Asia’s open. In fact, commodities broadly were hit sharply during that timeframe. Soft economic data and hawkish Fed speak have been a headwind this week, but less of a draw than expected on yesterday’s weekly EIA inventory report and news that Russia overproduced in April brought additional market pressures.
Have we hit peak pessimism? WTI Crude Oil futures tested and responded to a significant area of support overnight, potentially building out the right shoulder of an inverse head and shoulders going back to May 8th. As today’s session unfolds into the final day of the week, we believe continued price action above our Pivot and point of balance at 78.08, the .382 retracement back to the 80.11 high, will help invite fresh buying.
Bias: Neutral/Bullish
Resistance: 78.33-78.47***, 78.86-79.04***, 79.34**, 80.09-80.11***, 81.28***
Pivot: 78.08
Support: 77.35-77.60***, 76.63-76.82**, 75.70-76.46****, 74.66-74.70**
*Trade ideas cited above are for illustration only, as an integral part of a case study to demonstrate the fundamental concepts in risk management under the market scenarios being discussed. They shall not be construed as investment recommendations or advice. Nor are they used to promote any specific products, or services.
Futures trading involves substantial risk of loss and may not be suitable for all investors. Trading advice is based on information taken from trade and statistical services and other sources Blue Line Futures, LLC believes are reliable. We do not guarantee that such information is accurate or complete and it should not be relied upon as such. Trading advice reflects our good faith judgment at a specific time and is subject to change without notice. There is no guarantee that the advice we give will result in profitable trades. All trading decisions will be made by the account holder. Past performance is not necessarily indicative of future results.

Light Crude OilLight crude oil, with the fall of several months and the price correction, is now close to the main support and the past purchases made by investors. who have placed an order will approach and make a loss, and by following their analytical and investment path, you can achieve a good profit in the long term.
Sashacharkhchian

Can Crude Oil Futures Breakout?Technical Momentum Weakens
Crude Oil futures are declining in 2024 after correcting to the 200-day moving average at $77.55. The technical perspective shows momentum studies recovering from oversold territories, while the 9-day moving average is trading below the 18-day. DMI- is above DMI +, indicating that the market is in a correction phase, while the Average True Range declines to $1.46 daily.
API Inventories Rise
API Inventory has increased recently, indicating a more relaxed supply picture. Recent API inventory data shows a build of 2.5 million barrels. The current EIA inventories are 457 million barrels, compared to the five-year average of 475 million barrels for this period.
Cushing stocks in the Midwest show 35 million barrels in inventory versus a five-year average of 43 million barrels.
An Expanding Economic Tailwind
The U.S. economy continues to expand in 2024, driven by the high probability of a soft landing, which fuels investor sentiment. Geopolitical tensions have eased recently; however, there is the possibility of a widening Middle Eastern conflict in the future. Traders will remain focused on inflation data, inventory productions, and the direction of economic data.
www.tradingview.com
CME Real-time Market Data help identify trading set-ups and express my market views. If you have futures in your trading portfolio, you can check out on CME Group data plans available that suit your trading needs
Disclaimers
*Trade ideas cited above are for illustration only, as an integral part of a case study to demonstrate the fundamental concepts in risk management under the market scenarios being discussed. They shall not be construed as investment recommendations or advice. Nor are they used to promote any specific products, or services.
Futures trading involves substantial risk of loss and may not be suitable for all investors. Trading advice is based on information taken from trade and statistical services and other sources Blue Line Futures, LLC believes are reliable. We do not guarantee that such information is accurate or complete and it should not be relied upon as such. Trading advice reflects our good faith judgment at a specific time and is subject to change without notice. There is no guarantee that the advice we give will result in profitable trades. All trading decisions will be made by the account holder. Past performance is not necessarily indicative of future results.

Crude Wednesday Pre NewsSo this is the forecast for Crude pre 1030est news.
I'm favouring some BSL to be taken if the 1hr FVG gets disrespected.
With 1hr fvg above and the BSL that is pointed out with the arrows.
If we show rejection from the 1hfvg we are currently near then PDL will be the target.
With news there is no certainty.
Overall I am HTF bearish however a sweep on BSL could be on the cards today.

Buy oil stocksBuy oil stocks as described in the analysis provided and follow the steps specified in Stop Loss and Take Profit

$80 Headwinds, Any Hope for Crude Oil?Crude Oil (July)
Yesterday’s close: Settled 79.30, down 0.28
WTI Crude Oil futures started the week unenthusiastically with a failure at the psychological $80 mark that aligns with a key .382 retracement and fell short of pinging the 50-day moving average. OPEC+ instability was downplayed after the death of the Iranian President on Sunday, while prices have been in a downtrend since peaking on geopolitical tensions through mid-April, and seasonality concerns persist after the Memorial Day holiday. While we still see value against our critical area of support highlighted below, a continued test erodes confidence.
Bias: Neutral/Bullish
Resistance: 78.59-78.76**, 78.99*, 79.35-79.67**, 80.09-80.11***, 81.28***
Pivot: 78.25
Support: 77.65-77.86***, 77.26**, 75.70-76.36****
Check out CME Group real-time data plans available on TradingView here: www.tradingview.com
Disclaimers:
CME Real-time Market Data help identify trading set-ups and express my market views. If you have futures in your trading portfolio, you can check out on CME Group data plans available that suit your trading needs www.tradingview.com
*Trade ideas cited above are for illustration only, as an integral part of a case study to demonstrate the fundamental concepts in risk management under the market scenarios being discussed. They shall not be construed as investment recommendations or advice. Nor are they used to promote any specific products, or services.
Futures trading involves substantial risk of loss and may not be suitable for all investors. Trading advice is based on information taken from trade and statistical services and other sources Blue Line Futures, LLC believes are reliable. We do not guarantee that such information is accurate or complete and it should not be relied upon as such. Trading advice reflects our good faith judgment at a specific time and is subject to change without notice. There is no guarantee that the advice we give will result in profitable trades. All trading decisions will be made by the account holder. Past performance is not necessarily indicative of future results.

CL1!
Looks like a BUY to me
Wycoff pattern generally quite reliable
I'd say 80%
Just had quite a big pull back

[Commodity] Crude Oil Buy IdeaNote -
One of the best forms of Price Action is to not try to predict at all. Instead of that, ACT on the price. So, this chart tells at "where" to act in "what direction. Unless it triggers, like, let's say the candle doesn't break the level which says "Buy if it breaks", You should not buy at all.
=======
I use shorthands for my trades.
"Positional" - means You can carry these positions and I do not see sharp volatility ahead. (I tally upcoming events and many small kinds of stuff to my own tiny capacity.)
"Intraday" -means You must close this position at any cost by the end of the day.
"Theta" , "Bounce" , "3BB" or "Entropy" - My own systems.
=======
I won't personally follow any rules. If I "think" (It is never gut feel. It is always some reason.) the trade is wrong, I may take reverse trade. I may carry forward an intraday position. What is meant here - You shouldn't follow me because I may miss updating. You should follow the system I share.
=======
Like -
Always follow a stop loss.
In the case of Intraday trades, it is mostly the "Day's High".
In the case of Positional trades, it is mostly the previous swings.
I do not use Stop Loss most of the time. But I manage my risk with options as I do most of the trades using derivatives

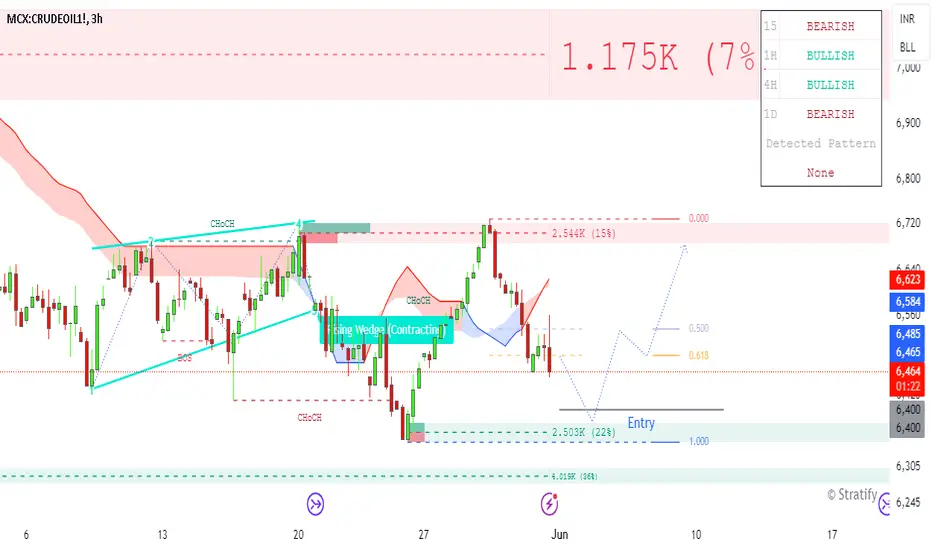
Crude Oil Weekly Analysis- 20th to 24th May 2024
Over view
As per my previous weekly analysis, Crude oil had great ride from beginning of this year and paused from previous month. Fortunately this was necessary for having further movement. We can consider the previous month process was retracement thus by expecting further movement in upcoming weeks.
Any small bounce from this level would be great bullish indications for good week ahead.
Weekly TF
Price has exactly reacted at 0.382 Fibonacci level which is good sign of bullish continuation.
Good green candle formation after doji formation & crossed 50 EMA
Day TF
Trend: Upward range with 3 consecutive support(HL 01, HL 02, HL 03).
Now HL04 has been created and rejected at same level by creating double bottom.
Inside candle breakout has been found after creating Doji & Bullish hammer.
Price has been rejected from crucial key level
0.5 Level rejected in Fibonacci
Buy:
Entry 01:6691
Entry 02: 6962
Final Target expected: 7235
Direct Gapup/Gapdown entry should be avoided
Get confirmation from any of the leading indicators before entering trade
Kindy comment below in case of any clarification required on this particular idea.
Please follow for more ideas
MCX:CRUDEOIL1!

Short OILMaduro will lose the venezuelan election and liberate lots of supply to the market. USA will ease Venezuela sanctions.

5/12 | $CLNot too much to update here as we are still stuck in a range as expected. We got a new low last Wednesday with strong buyside reaction. Very trappy PA. This week, I would ideally like to see buyside liquidity @79.96 get taken and buy the retracement to catch a move higher. Area of interest below @77.85.

BUY CL (CRUDE OIL)BUY CL at the 79.15 or the 78.00 price levels, going back up to the 90.00 to 95.00 price and beyond.

WTI trading plan - 16 May 2024NYMEX:CL1!
Longer term trend is still bearish. But Price is trading above 50 SMA, suggesting a short-term bullishness.
Will attempt for intra-day longs today with stops below the 50 SMA.


Crude - Testing the waters...We saw our weekly target hit yesterday,
I have a hunch as on the Daily we are constantly going back to the middle of the range that bsl of some form is in the eye of the market before we would want to move down.
I ask myself.... Why would we want to go all the way back (weekly ssl level) if we have been here and raided Sell Stops... If I was the market I would want some breakfast first before I head down for lunch and dinner right?
So for PRE 0930EST im watching to see if price respects the 4hr FVG's.
This will indicate some bsl to be taken.

CL1 WeeklyThesre is a Wolfe Wave and Price hugging that Extended 1-4 Line in future is Possible .
For price to pop above that Channel to 110.00 Area is also possible .
All my Price levels are based on Fib's .
So we could be locked in this Channel for a few Months
