AAPL (Apple Inc.) on a 4-hour timeframe.AAPL (Apple Inc.) on a 4-hour timeframe.
Here’s what the chart shows:
The current price is around $247.80.
There is an uptrend line supporting the price.
Two target levels are marked on the chart with arrows pointing upward.
The Ichimoku cloud shows bullish momentum (price above the cloud).
📈
Key facts today
Next report date
—
Report period
—
EPS estimate
—
Revenue estimate
—
6.61 USD
93.74 B USD
391.04 B USD
14.83 B
About Apple Inc
Sector
Industry
CEO
Timothy Donald Cook
Website
Headquarters
Cupertino
Founded
1976
ISIN
US0378331005
FIGI
BBG000B9XRY4
Apple, Inc engages in the design, manufacture, and sale of smartphones, personal computers, tablets, wearables and accessories, and other variety of related services. It operates through the following geographical segments: Americas, Europe, Greater China, Japan, and Rest of Asia Pacific. The Americas segment includes North and South America. The Europe segment consists of European countries, as well as India, the Middle East, and Africa. The Greater China segment comprises of China, Hong Kong, and Taiwan. The Rest of Asia Pacific segment includes Australia and Asian countries. Its products and services include iPhone, Mac, iPad, AirPods, Apple TV, Apple Watch, Beats products, Apple Care, iCloud, digital content stores, streaming, and licensing services. The company was founded by Steven Paul Jobs, Ronald Gerald Wayne, and Stephen G. Wozniak in 1976 and is headquartered in Cupertino, CA.
Related stocks

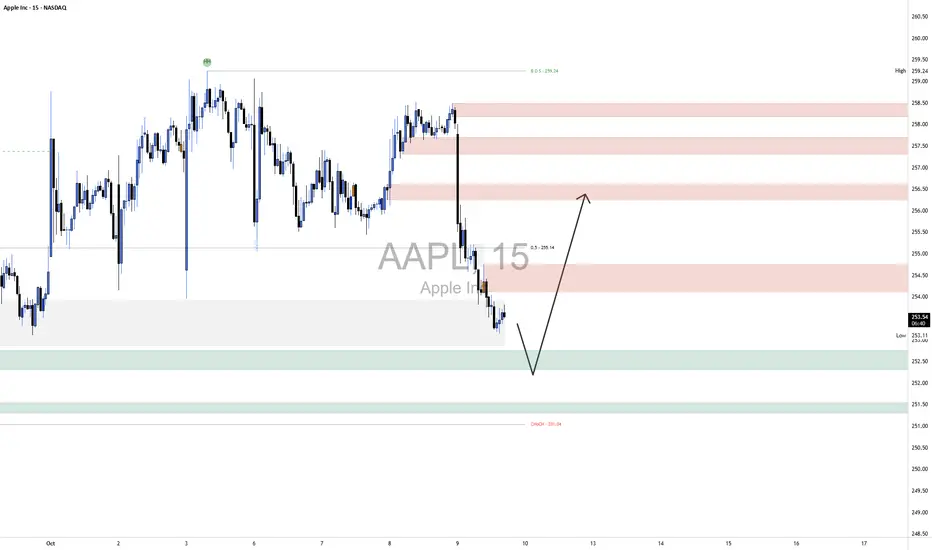
AAPL LongThe broader market structure shows that AAPL recently transitioned from a bullish leg to a clear short-term bearish phase after a strong Break of Structure (BOS) at 259.24, which confirmed a shift in control from buyers to sellers. Price failed to make a new high after the last rally, and the subseq
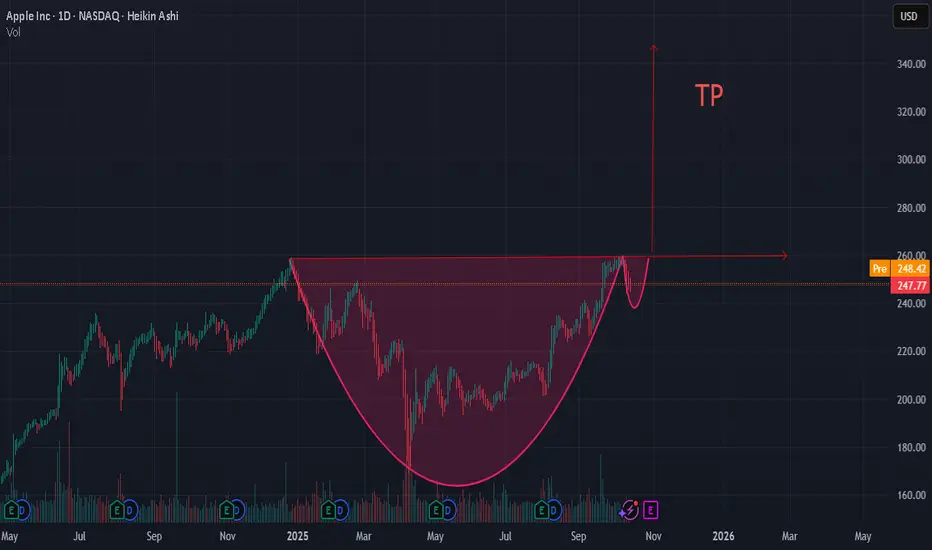
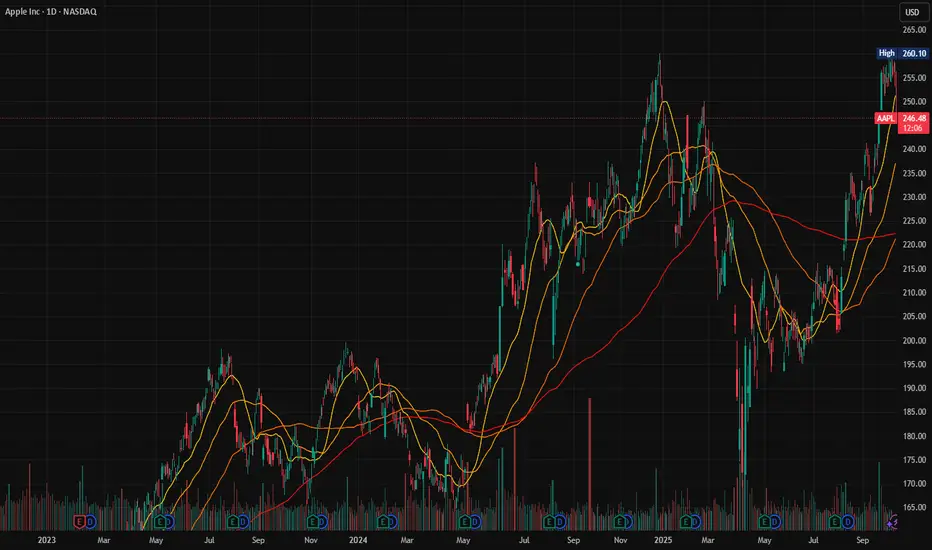
CUP AND HANDLE ON AAPL TP 340 LONGApple moves in a 10-15% range for years!
With lowering interest rates, and with quite low P/E ratio (32), compared to other companies in this industry, a new wave can begin!
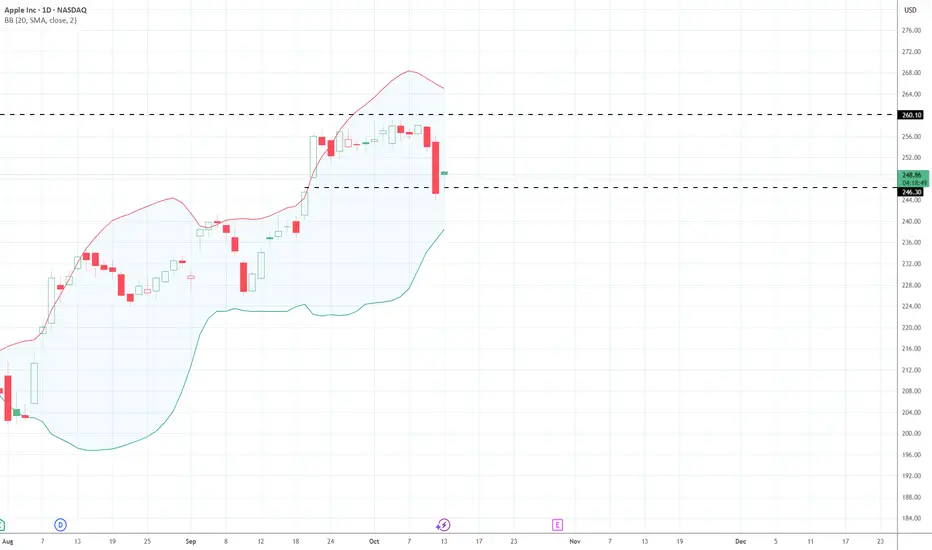
Daily BB reached, expect some flagging A quick one before the close. The Daily BB has been reached, so I expect a pause here. If we do drop over the weekend, this area should get tested before we drop further.
AAPL is hinting at a possible ABC on the weekly chart.

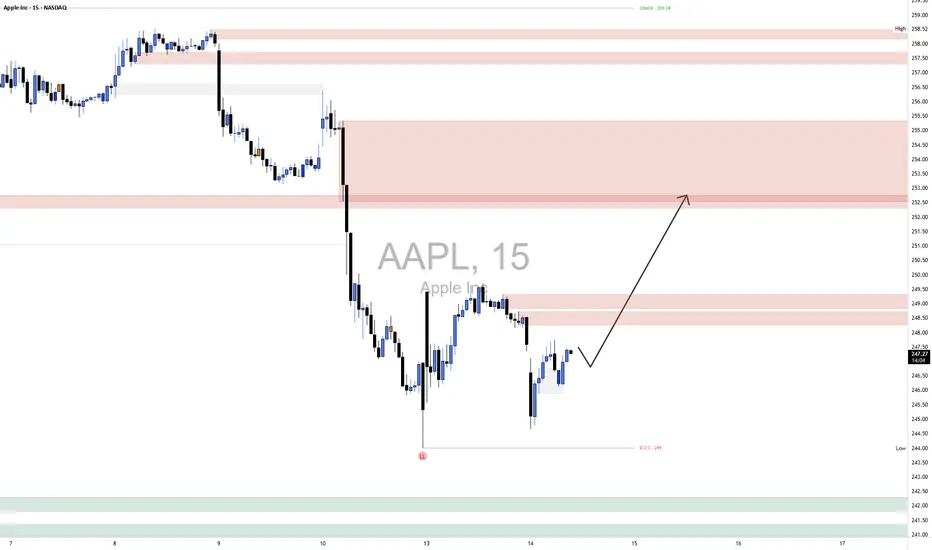
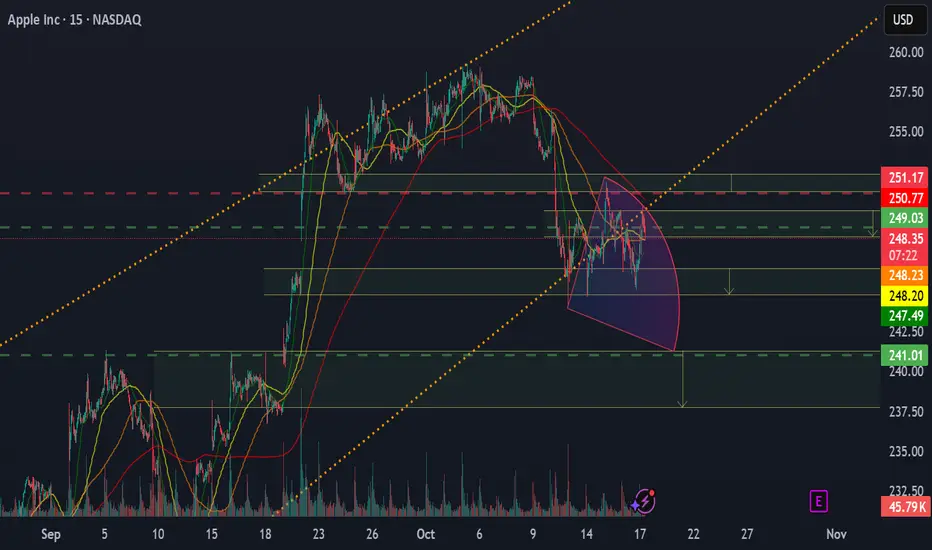
AAPL LongMarket Structure:
Apple remains in a short-term downtrend, following a clear Break of Structure (BOS) to the downside around $244, confirming bearish continuation from the prior lower high near $254. However, the recent candle formation suggests a possible Change of Character (CHoCH) as price begins
AAPL Gap FillLooks like they got their gap fill after all... could push through ath now.
Also someone just bought $334.5 million in shares today
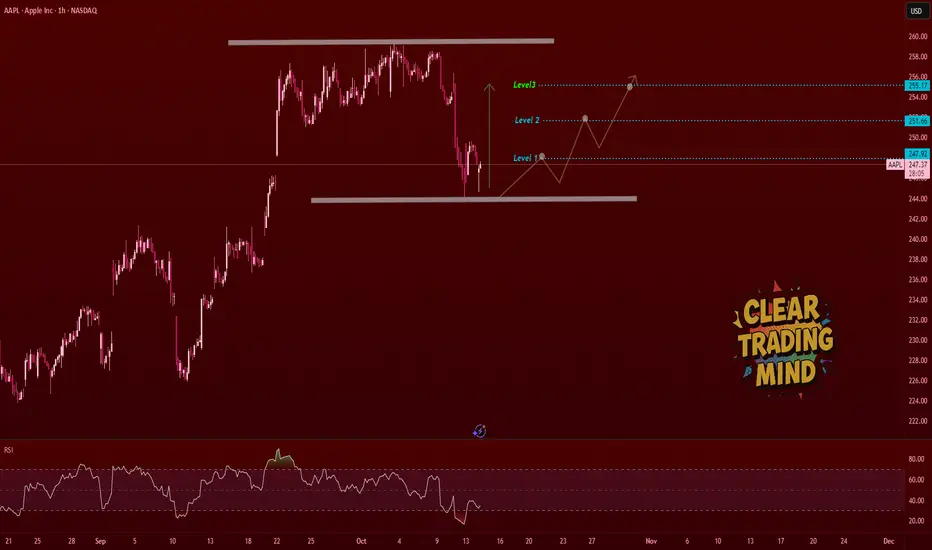
AAPL Bullish Outlook – Level-by-Level Breakout PlayApple is showing a potential bottom structure after rejecting the demand zone at the lower range.
Price bounced from the base and looks ready for a step-by-step move upward.
🔍 My Bullish Plan (1H Chart):
- As long as price holds the bottom range, I expect a recovery move.
- Watching price break
Apple short ideaApple looks overextended after the recent rally, showing signs of exhaustion near resistance. Price momentum is slowing, and volume confirms reduced buying pressure. I expect a short term correction as the market takes profits and sentiment cools down.
I am opening a short position with a target at
$AAPL Call Alert – Oct 31 ’25 $250 Calls | 119% ROI PotentialEnter: NASDAQ:AAPL OCT 31 2025 $250 CALLS
Buy in Price: $6.27 - $6.35
Take Profit: $13.73
Stop Bleeding: $5.52
ROI Potential: 119%
Exit Within: 354 Minutes
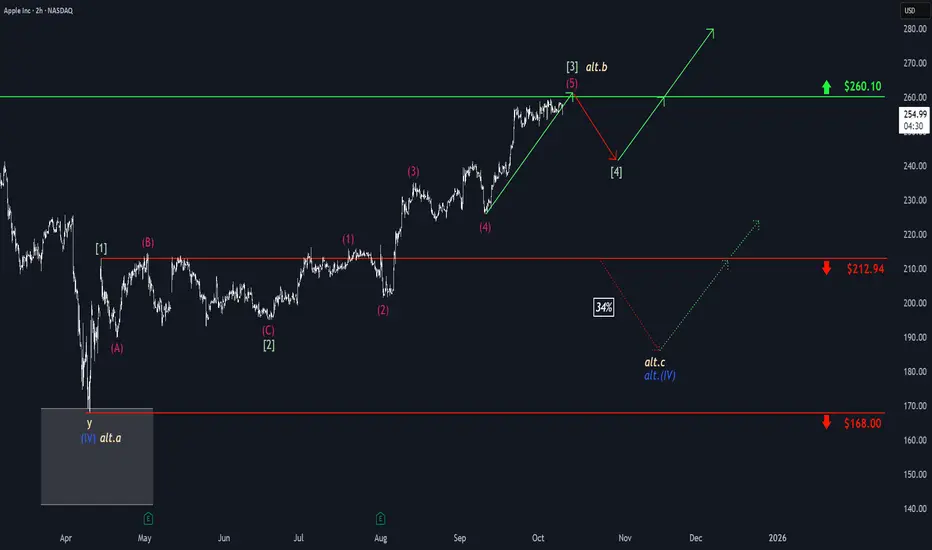
Apple: Rally Has a Bit More Room to RunApple’s upward momentum has clearly slowed at the $260.10 resistance level, though the stock has already come very close to this mark. As a result, we’re allowing for a bit more room for green wave to run in the near term, with the possibility that AAPL could slightly surpass the $260.10 level. Ho
See all ideas
Summarizing what the indicators are suggesting.
Neutral
SellBuy
Strong sellStrong buy
Strong sellSellNeutralBuyStrong buy
Neutral
SellBuy
Strong sellStrong buy
Strong sellSellNeutralBuyStrong buy
Neutral
SellBuy
Strong sellStrong buy
Strong sellSellNeutralBuyStrong buy
An aggregate view of professional's ratings.
Neutral
SellBuy
Strong sellStrong buy
Strong sellSellNeutralBuyStrong buy
Neutral
SellBuy
Strong sellStrong buy
Strong sellSellNeutralBuyStrong buy
Neutral
SellBuy
Strong sellStrong buy
Strong sellSellNeutralBuyStrong buy
Displays a symbol's price movements over previous years to identify recurring trends.
APCL
Apple Inc. 3.6% 31-JUL-2042Yield to maturity
5.34%
Maturity date
Jul 31, 2042
US37833ER7
Apple Inc. 4.1% 08-AUG-2062Yield to maturity
5.23%
Maturity date
Aug 8, 2062
US37833EK2
Apple Inc. 2.7% 05-AUG-2051Yield to maturity
5.22%
Maturity date
Aug 5, 2051
US37833EG1
Apple Inc. 2.8% 08-FEB-2061Yield to maturity
5.22%
Maturity date
Feb 8, 2061
US37833EL0
Apple Inc. 2.85% 05-AUG-2061Yield to maturity
5.21%
Maturity date
Aug 5, 2061
US37833EF3
Apple Inc. 2.65% 08-FEB-2051Yield to maturity
5.21%
Maturity date
Feb 8, 2051
US37833DZ0
Apple Inc. 2.4% 20-AUG-2050Yield to maturity
5.19%
Maturity date
Aug 20, 2050
US37833EQ9
Apple Inc. 3.95% 08-AUG-2052Yield to maturity
5.19%
Maturity date
Aug 8, 2052
US37833DQ0
Apple Inc. 2.95% 11-SEP-2049Yield to maturity
5.18%
Maturity date
Sep 11, 2049
US37833DD9
Apple Inc. 3.75% 12-SEP-2047Yield to maturity
5.18%
Maturity date
Sep 12, 2047
US37833DW7
Apple Inc. 2.65% 11-MAY-2050Yield to maturity
5.18%
Maturity date
May 11, 2050
See all AAPL bonds
Curated watchlists where AAPL is featured.


Frequently Asked Questions
The current price of AAPL is 252.29 USD — it has increased by 0.98% in the past 24 hours. Watch Apple Inc stock price performance more closely on the chart.
Depending on the exchange, the stock ticker may vary. For instance, on NASDAQ exchange Apple Inc stocks are traded under the ticker AAPL.
AAPL stock has fallen by −1.99% compared to the previous week, the month change is a 4.56% rise, over the last year Apple Inc has showed a 8.08% increase.
We've gathered analysts' opinions on Apple Inc future price: according to them, AAPL price has a max estimate of 310.00 USD and a min estimate of 180.00 USD. Watch AAPL chart and read a more detailed Apple Inc stock forecast: see what analysts think of Apple Inc and suggest that you do with its stocks.
AAPL reached its all-time high on Dec 26, 2024 with the price of 260.10 USD, and its all-time low was 0.05 USD and was reached on Jul 8, 1982. View more price dynamics on AAPL chart.
See other stocks reaching their highest and lowest prices.
See other stocks reaching their highest and lowest prices.
AAPL stock is 2.47% volatile and has beta coefficient of 1.19. Track Apple Inc stock price on the chart and check out the list of the most volatile stocks — is Apple Inc there?
Today Apple Inc has the market capitalization of 3.67 T, it has increased by 0.40% over the last week.
Yes, you can track Apple Inc financials in yearly and quarterly reports right on TradingView.
Apple Inc is going to release the next earnings report on Oct 30, 2025. Keep track of upcoming events with our Earnings Calendar.
AAPL earnings for the last quarter are 1.57 USD per share, whereas the estimation was 1.44 USD resulting in a 9.18% surprise. The estimated earnings for the next quarter are 1.76 USD per share. See more details about Apple Inc earnings.
Apple Inc revenue for the last quarter amounts to 94.04 B USD, despite the estimated figure of 89.56 B USD. In the next quarter, revenue is expected to reach 101.69 B USD.
AAPL net income for the last quarter is 23.43 B USD, while the quarter before that showed 24.78 B USD of net income which accounts for −5.43% change. Track more Apple Inc financial stats to get the full picture.
Yes, AAPL dividends are paid quarterly. The last dividend per share was 0.26 USD. As of today, Dividend Yield (TTM)% is 0.41%. Tracking Apple Inc dividends might help you take more informed decisions.
Apple Inc dividend yield was 0.43% in 2024, and payout ratio reached 16.11%. The year before the numbers were 0.55% and 15.32% correspondingly. See high-dividend stocks and find more opportunities for your portfolio.
As of Oct 17, 2025, the company has 164 K employees. See our rating of the largest employees — is Apple Inc on this list?
EBITDA measures a company's operating performance, its growth signifies an improvement in the efficiency of a company. Apple Inc EBITDA is 141.70 B USD, and current EBITDA margin is 34.44%. See more stats in Apple Inc financial statements.
Like other stocks, AAPL shares are traded on stock exchanges, e.g. Nasdaq, Nyse, Euronext, and the easiest way to buy them is through an online stock broker. To do this, you need to open an account and follow a broker's procedures, then start trading. You can trade Apple Inc stock right from TradingView charts — choose your broker and connect to your account.
Investing in stocks requires a comprehensive research: you should carefully study all the available data, e.g. company's financials, related news, and its technical analysis. So Apple Inc technincal analysis shows the buy rating today, and its 1 week rating is buy. Since market conditions are prone to changes, it's worth looking a bit further into the future — according to the 1 month rating Apple Inc stock shows the buy signal. See more of Apple Inc technicals for a more comprehensive analysis.
If you're still not sure, try looking for inspiration in our curated watchlists.
If you're still not sure, try looking for inspiration in our curated watchlists.