

Next report date
Report period
Q1 2024
EPS estimate
−0.01USD
Revenue estimate
107.09 MUSD
0.59USD
28.16 MUSD
636.32 MUSD
45.94 M
About Cohu, Inc.
Sector
Industry
CEO
Luis Antonio Müller
Website
Headquarters
Poway
Employees (FY)
3.26 K
Founded
1947
FIGI
BBG000DKMJ86
Cohu, Inc. engages in the provision of back-end semiconductor equipment and services. It offers test and handling capital equipment, interface products, and related services to the semiconductor and electronics manufacturing industries. The company was founded in 1947 and is headquartered in Poway, CA.
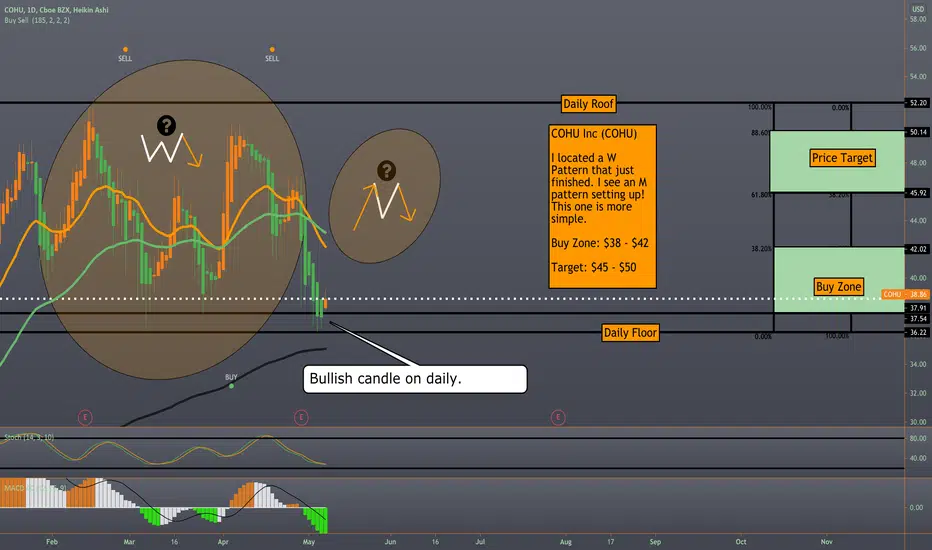

COHU #breakingout of #CupandHandle #ChartPatternI posted about this pattern forming few days back and we seem to have gotten the breakout today from the #cupandhandle #chartpattern. If the market doesn't pull back hard from here (what? ), this one is heading higher and towards the #chartpattern price target.
post from few days ago.
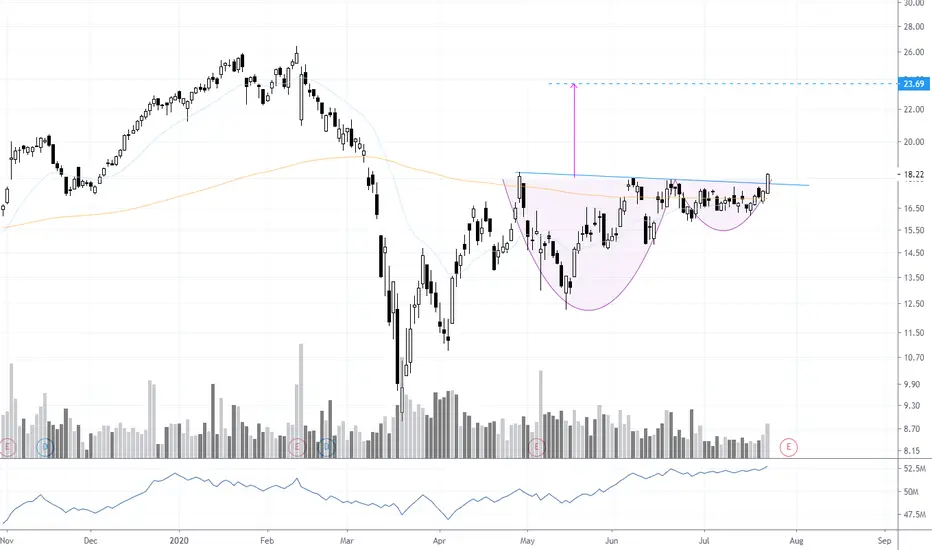
COHU Forming a Well Defined #CupandHandle #ChartPatternClear horizontal resistance on this cup and handle pattern against NASDAQ:COHU . A decisive breakout opens the door to test early year's high around $26. Breaking the pattern resistance also breaks the 200 day MA to the upside, adding to the validity of the breakout.


COHU Detected possible increase in guidance!!!COHU: cohu inc
2018-03-21 08:00:14
Detected possible increase in guidance
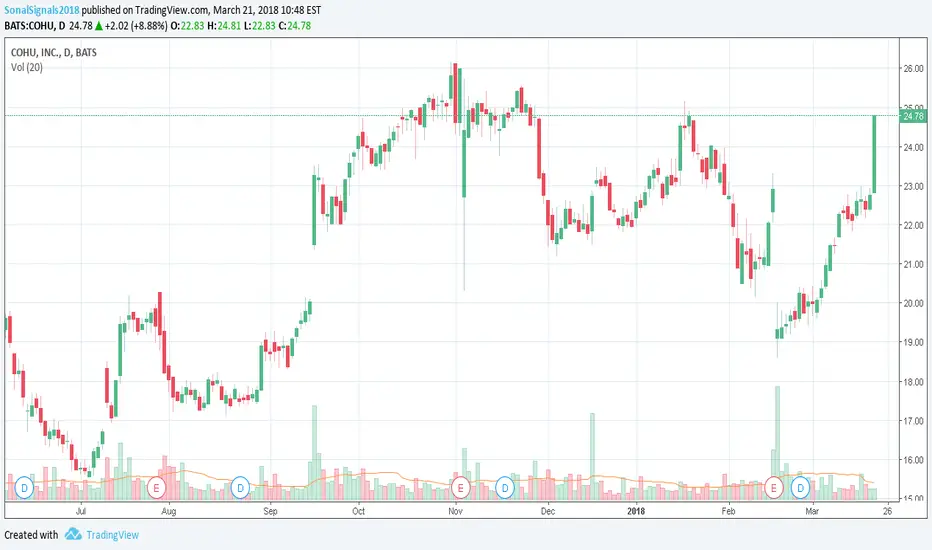
Going long COHU on Wednesday. COHU is printing a bullish candle over candle price bar on above average volume, near its 50 DMA, with my momentum/trending oscillators confirming the price move. I am going long COHU on Wednesday using a limit order (GTC-BUY-LMT) @ 25.43. I will have two trailing sell stops (GTC-SELL-STP) @ 23.73 a

See all ideas
Trade directly on the supercharts through our supported, fully-verified and user-reviewed brokers.


Frequently Asked Questions
The current price of COHU is 31.08 USD — it has increased by 0.78% in the past 24 hours.
Depending on the exchange, the stock ticker may vary. For instance, on NASDAQ exchange Cohu, Inc. stocks are traded under the ticker COHU.
Cohu, Inc. is going to release the next earnings report on May 2, 2024. Keep track of upcoming events with our Earnings Calendar.
COHU stock is 3.43% volatile and has beta coefficient of 1.74. Check out the list of the most volatile stocks — is Cohu, Inc. there?
COHU earnings for the last quarter are 0.35 USD per share, whereas the estimation was 0.32 USD resulting in a 9.25% surprise. The estimated earnings for the next quarter are 0.23 USD per share. See more details about Cohu, Inc. earnings.
Cohu, Inc. revenue for the last quarter amounts to 150.80 M USD despite the estimated figure of 150.10 M USD. In the next quarter revenue is expected to reach 136.83 M USD.
Yes, you can track Cohu, Inc. financials in yearly and quarterly reports right on TradingView.
COHU stock has risen by 6.99% compared to the previous week, the month change is a 0.32% fall, over the last year Cohu, Inc. has showed a 6.19% decrease.
COHU net income for the last quarter is −2.03 M USD, while the quarter before that showed 3.92 M USD of net income which accounts for −151.80% change. Track more Cohu, Inc. financial stats to get the full picture.
Today Cohu, Inc. has the market capitalization of 1.46 B, it has decreased by 4.59% over the last week.
Like other stocks, COHU shares are traded on stock exchanges, e.g. Nasdaq, Nyse, Euronext, and the easiest way to buy them is through an online stock broker. To do this, you need to open an account and follow a broker's procedures, then start trading. You can trade Cohu, Inc. stock right from TradingView charts — choose your broker and connect to your account.
As of Apr 27, 2024, the company has 3.26 K employees. See our rating of the largest employees — is Cohu, Inc. on this list?
Investing in stocks requires a comprehensive research: you should carefully study all the available data, e.g. company's financials, related news, and its technical analysis. So Cohu, Inc. technincal analysis shows the neutral today, and its 1 week rating is sell. Since market conditions are prone to changes, it's worth looking a bit further into the future — according to the 1 month rating Cohu, Inc. stock shows the sell signal. See more of Cohu, Inc. technicals for a more comprehensive analysis.
If you're still not sure, try looking for inspiration in our curated watchlists.
If you're still not sure, try looking for inspiration in our curated watchlists.
We've gathered analysts' opinions on Cohu, Inc. future price: according to them, COHU price has a max estimate of 45.00 USD and a min estimate of 30.00 USD. Read a more detailed Cohu, Inc. forecast: see what analysts think of Cohu, Inc. and suggest that you do with its stocks.
EBITDA measures a company's operating performance, its growth signifies an improvement in the efficiency of a company. Cohu, Inc. EBITDA is 103.48 M USD, and current EBITDA margin is 16.25%. See more stats in Cohu, Inc. financial statements.