Cron's Warrant Liability To Inflate 3rd Quarter Earnings ResultsI haven't quite figured out yet why the price went up so much in the afterhours yesterday, but I think the the clue is in the pipeline SEC litigation from 2011. This was the first dark pool to be fined by the SEC
CRON trade ideas


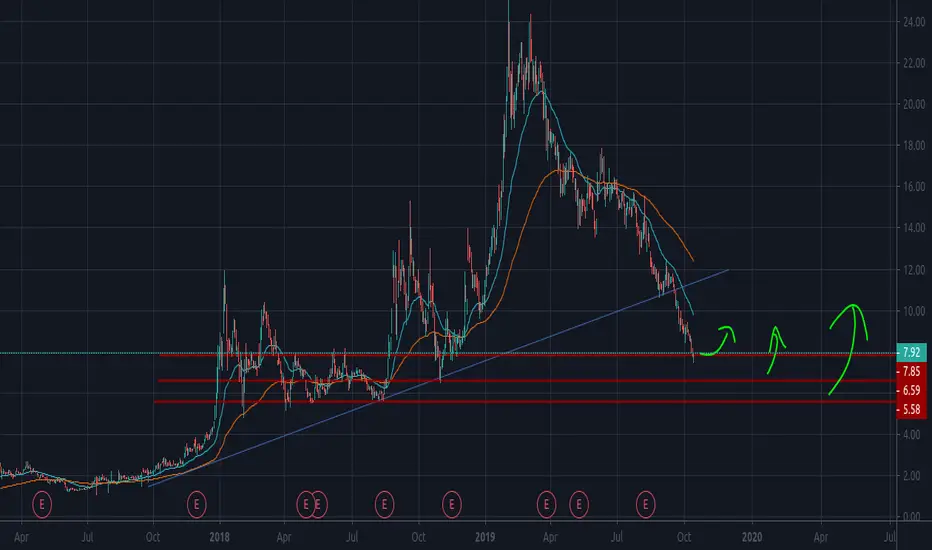
LONG CRONExpecting bounce from extremely oversold weekly and daily levels. If stop breached, be prepared to catch new daily reversal on lower levels with a tight stop.


CRON coming down into big demand zoneCRON has made it to the basement. I would be very surprised not to see some accumulation in this area.
The RSI has not been this low since 2017. There can't be many sellers left...can there? That said I will not be
a buyer until I see the downward trend line broken to the upside.

Lying in wait for one final low in CRONI think after a hit of 8.0 region in CRON, we will be off to the races

LONG CRONExpecting bounce from extremely oversold weekly and daily levels. If stop breached, be prepared to catch new daily reversal on lower levels with a tight stop.

Possible Consolidation/Trend Change On CRONCronos Group had a strong uptrend and maintained it for about a year when there was a lot bullish speculation around cannabis as more states in the U.S. began to legalize the plant for recreational and medical use. There were huge estimations on the total worth of the market, however, an estimation on any market will come with errors, estimations on the size of black markets are even more difficult to estimate as there will be a significant amount of errors due to missing data or due to proxying variables to substitute for the missing variables. In addition, the demand for legal cannabis varies dependent on the cost and quality of black market contraband. Once actual revenue started coming in for these companies and solid data, most investors left the space.
The Fundamentals:
As I am still developing my understanding of the financials of businesses, I still understand the balance sheet at a basic level, and currently, the business is still incurring a loss despite increasing its revenue significantly. At the early stage of businesses its not uncommon for them to take on debt, I am not sure on the exacts of the ratio a company should incur in debt, but this is something I will do more research on.
The Chart:
On the daily, it appears like the current movement is slowing down as the real bodies for these candles are shrinking, the current candle on the daily is a potential 3 candlestick reversal known as a morning star. If it reverses here on the daily, it is likely a reversal candle will be printed on the weekly. Another thing to note is that the price is currently at a level of support.
On the RSI, there is a descending trendline and price action has been accelerating to the downside. It is possible to try a longer term position with the RSI trendline kept in mind as a possible area to take profit and such, but that event would take more time and possibly more downside to occur, once the morning star is confirmed a shorter term long position is possible.


Cron has been brutal, but... This is where I think we are, closing in at the end of the ABCDE, ABC, ABCDE consolidation. If the chart holds, I am looking for the final E wave to bounce off the channel around the 8 USD mark, and from there, we begin impulse wave #1 of the next Elliot cycle.


CRON approaching major D supportCRON with increasing bear volume approaching major Daily support at 9.60.
It will be a good trade to get in when Daily RSI will be oversold with D support.
Major Investment in CRON was at 17 CAD.


CRON TESTING TREND LINE!Hello Traders,
Welcome back to another chart, Today’s chart will be on the MJ sector – CRON
Points to consider,
- Price is trending bullish up retest of trend line
- Local resistance a .618 Fibonacci Line
- RSI coming into apex
- Stochs testing resistance
- EMA’s giving price resistance at current given time
- Volume is well below average
- VPVR, showing low volume of transactions from current point
- Current support is being held by the Fibonacci extension – 1.272 zone
CRON is in an interesting place at current given time, it is testing it’s upwards trend line, CRON bulls and or bears have an opportunity to take over from this point…
Price is currently testing support being provided by the Fibonacci Extension which is in confluence with the upwards trend line. Bull have the probability of pushing price up from here as CRON has had a major downwards rally, it would only be natural for the price to have a relief rally…
The RSI is getting closer to its apex whilst the stochastics is testing its local resistance. Volume is currently well below average, we need to see an increase in volume if price where to break either direction.
If CRON is able to respect its trend line, then the probability of retracing back to the .618 Fibonacci is more favourable, posting a potential gain of 20.56%. However if bears break this support and trend line, then CRON can test next lower local support, posting a gain of 27%...
A break either way needs to be confirmed with volume, the VPVR shows low levels of transactions from this point both ways, price should be able to reach targets comfortable upon breakout…
What are your thoughts?
Will CRON respect trend line or break bearish and test lower levels?
Please leave a like and comment
And remember,
“Amateurs think about how much money they can make. Professionals think about how much money they could lose.” – Jack Schwager

CRON house of pain over? CRON has been on a horrible downfall over the past months. Looks like it could have found its bottom. On a technical basis looking for a trade to 14$


CRON readyDaily bull div on CRON, crushed earnings, at support and VRPR POC. 14 day calls, OTM price .15 with a delta of .18, have to take it

Straddle option strategy on CRON wedgeIt's roughly $200 for each straddle with a 14 strike and expiration of Aug 30.


CRON - ShortingDon't get me wrong, overall I am bullish on this stock. Coming up, however, we are due for a correction from a market driven largely by news / media. Check the financials.
Keep in mind everything from 1/28 -> on could be artificial movement due to Kramer calling it out on TV. I would expect quite a big profit taking coming up, wouldn't be surprised by a drop of 38% from current rise ($14 price), or even more, before the strong resistance kicks in. I love this stock (bought in at $7.62 / pre Altria) but all rides up have their downs.
2 things to look at on longer charts. 1D, and 1W. Developing rising wedge - unavoidable from recent news attention. Bearish Divergence seen in the RSI. Overbought, and decreasingly so. My sell limit is at a conservative $20. However, it may be reasonable to expect a $22-24 price before the correction.
I have charted a Fib Retrace from current low, expecting a 38% profit taking. Keep in mind, if the price goes > $19.50, the Fib Retrace needs to be adjusted for newer buy targets. Currently, I am looking at nice round numbers of $14 (best estimate), $12, or $10 (least likely). At least we have our Resistance levels marked, if there is a correction.

Cronos Group Inc. (CRON) long.All description on the chart.
Please, don't forget to like and follow.
Thank you.

CRON - Two Tries & Fail Trade- CRON had a 300% increase in price between 2018-2019
- Followed by a seemingly healthy technical correction reaching the 618 Fib level
- Now, price has attempted to break that level twice, and failed
- On RSI, trend-line was broken and new higher low formed
- It has also formed a textbook bullish candlestick pattern on second attempt
----------------------------------------------------------------------------------------------------------
- Therefore two trade ideas can be generated with entries and stop loss being based off
the supporting demand zone or the candlestick pattern.
- The candlestick pattern allows you to risk more and take profits quicker, by having a smaller stop loss and allowing a higher number
of shares to be bought, but comes with higher risk of volatility taking out this stop loss before profits can be realized
- Risk may be placed on ONE idea or DIVERSIFIED into the two trading plans.
- Both trading plans have their own stop loss and both meet their individual required limits of at least 1:2 Risk/Reward
Disclaimer: Always ***measure & accept*** potential risk before entering any trade.
