Short the MF big time HIGHLY OVERBOGHT, 84RSI. Today is a short covering day. Let it settle and this will come down to 12 level soon. No shares avaialble to short. If YEs then its 16% Interest.
CRON trade ideas
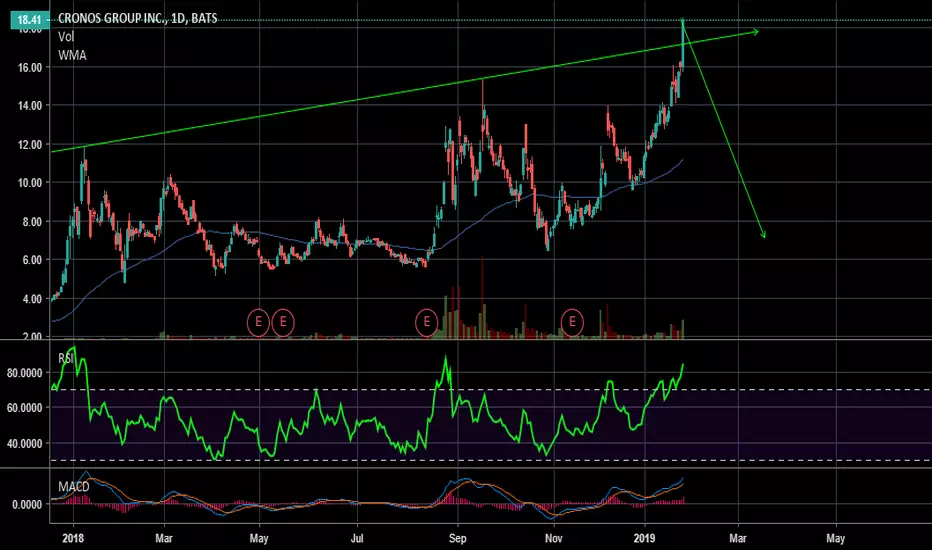
CRON - Will it have an extended 3rd wave?Still on track. The purple line shows an approximate trail for CRON. Today is a nice strong up day. This could just be the first of many strong waves in an extended 3rd wave pattern... time will tell.
I have been bullish on this stock since last year. After the initial pop, we sold for a double. Then we didn't chase it, we "retraced it" to give us another 2nd chance to get in as shown by the little green buy zone.
Looks like now we'll soon finish this first wave 1 of 3. In the next month or so we should see another retracement of this recent wave 1 of 3 move.
That would be another 3rd chance for those that want to get in.
If your in now, just stay on for the ride. This could be a nice 10-20 bagger :)

The last Bullish Engulfing Candle?CRON is trading through the Channel now. Could we see a break up or a bounce from the upper channel.


CRON Pre-market dumping. Watching for bounce.CRON Sells through 14 I will be watching for bounce near 1H 200MA at 13.30 ish.

C(h)ronos - the god of well-timed tradesCronos, the cannabis company has showed recently a lot of momentum. Stock market rally is of use here. But as the market looks like if it is wondering about its next move, this stock looks like it is poised to go down. It has a history of pullbacks whenever it crosses upper kelt. I believe there may be a pullback to around 13.63-12.85 within a couple of days. However there is a chance on trend continuation if the price breaks 17.72 on big volume.
A lot depends also on the greater market. If it falls or stays flat, I expect the stock to fall, if it ramps up, the stock may stay flat or go slightly up but not for long.

$CRON Breakout Above 52 week highs!I've identified a significant support at 12.90 and resistance at 15.22. $CRON is trading in an upward channel since Christmas. Intraday high Friday already tested the 52 week high. I project that we will pull back and consolidate for a breakout above $15.22 and run up: possible as high as $17 next week. I see a lot of momentum behind the cannabis sector and this stock in particular.

CRON Cup and Handle - Watching for breakoutI have been playing with options for CRON for a little and personally I like the company a lot and see tons of potential for future growth.
A textbook cup and handle pattern forming on the 1h. RSI and MACD showing signs of upward momentum but volume is lower than I would like.
If it is able to break out I can see this going to $16 and I have a target of at least $20 by year end.

CRON Possible BreakoutWas watching CRON for awhile the other day and waiting for a slight breakout, believe this setup could push near 14 with good volume. Both RSI and MACD confirm a good run, just wish their was a bit more volume to confirm.

Watch CRON for a BreakoutCRON has formed an inverse head and shoulders pattern, I am watching for a breakout of the neckline.

Cronos/Altria dealPpl taking profit. I did already. Wait for support to buy back. I will. Easy money folks.

CRON two potential plays this weekCRON looks like it wants to break out. With set ups like this I either look to buy on a pull back into support for a pre break out buy or will I sell into parabolic breakouts at the 1.27 inversion.
Please note I am a short term trader.

CRON Forecast... Probably topped out, target $8Keep in mind this is the Canadian chart. Possibility for new highs at $20, but likely falling to $8. PE > 250, production is inadequate; and most importantly, the technicals aren't there for a sustained pump.

CRONOS GROUP (CRON) Analysis- CANNABIS STOCK- long positionIG: BULLRINGANALYSIS
upward trend on RSI
Cross on diverging triangles
MA crossover into bull territory
Follows DJI fairly close. Short term decline in realm of possibilities, then small pump upward
not financial advice


CRONOS GROUP, CRON, Bull Run Once Support Has Been Tested!Self explanatory chart....Bull Run coming with three possible upward movements at key support levels which can be supported by the 50, 100, and 200 day EMA's ranging from the next week to next month. Win, win, and win situation!
Get into the Canadian Weed market now while the U.S. market tanks in 2019.

CRON, Medium, 8 - 16 January Support and 5th Wave Confirmation!I looked once last time after utilizing the 50, 100, and 200 moving averages and adding a massive Elliot wave that encompasses months worth of price movement. The good news is that no matter how you look at it, this stock is bouncing predictably off of the upper and lower price channel and showing a general positive movement. Those 50,100, and 200 EMA's along with the historical support levels all line up to show that we are nearing the bottom of our consolidation and that the green or blue wave (4) patterns and subsequent (5) are the likely scenario during the month of January. We'll know by mid-month!
G'luck!

CRONOS, Medium, Key Support Levels Support A Bull Run!Pretty self explanatory chart....we are approaching our first key support level...if we break below it then the 2nd scenario would play out, etc.
Yes, in every scenario it is a Win, Win. Stay in the Canadian Weed Market. If you aren't in it yet, GET IN!
The majority of U.S. stocks will be impacted over the entire 2019 during the massive upcoming DJIA correction.

The trading system Equity Trend to go long in #CRONToday at the market open (Dec 19), the equity trading system Equity Trend will open a long position in Cronos Group (ticker: CRON)
Stock:
- Long - CRONOS GROUP INC. COMMON SHARE - Ticker: CRON
Each day, the system scans around 10,000 stocks to find just 1 or 2 which are ready to move immediately.
The system combines elements of breakout trading, trend following and risk management from Turtle trading.
System: bit.ly

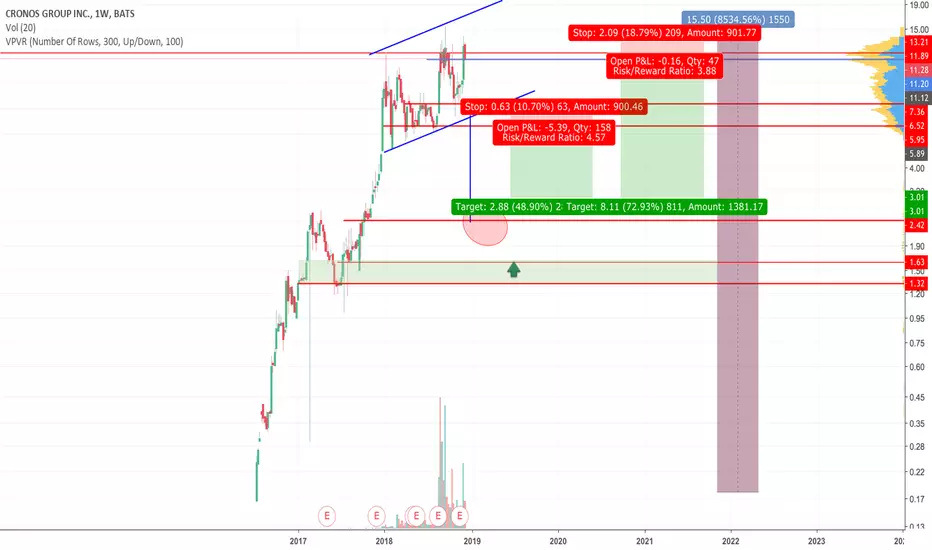
Marijuana how deep is your love?)The crazy growth of the cannabis sector is amazing, X's in a short amount of time). Will there be a repeat of the history of Bitcoin, a sharp rise and the same sharp drop of 80-90%? Logically, the correction should be, let's see how deep.
1 option
Sell short 11 $
Stop 13 (-15.5%) - a big stop, but significant priorities, you can enter in parts as the price moves in the right direction
Profit $ 3 (70%)
Option 2
Sell short 6 $
Stop $ 6.6 (11%)
Profit $ 3 (50%)
Possible to drop to $ 1.5
GAP-FILL opportunity on CRON - Short term profit CRON shows a nice gap-fill pattern as I highlighted.
If the stock trades lower on the pre-market, it'll be much riskier, so be careful.
If you feel like tipping: www.paypal.me

Cron may be starting long descent.Slightly overbought on the Daily and near the top of the channel. CRON is getting ready for a large pullback.
I will be looking to buy in the $12 range which would start forming a nice equalizing pattern, though it will largely depend on what the indicators look like at that time.

CRON - Head and Shoulders or Fibonacci Retrace?Everyone can see the Short Term Head and Shoulders Pattern, starting in August until now. A peak of $13.44, a push to $15.30, and losing steam rolled up to $13.00 before tanking. But let's say this H&S pattern was correctly called. Now what?
We take previously charted trendlines, which are still unbroken. The bullish market for this stock continues long term, despite short term losses erasing gains. The H&S pattern dictates a potential loss equal to the vertical distance of the neckline and the head. Some have charted this around a $5.00 vertical, starting at $8.72. This should put us down to $3.72 area.
However, if we draw a Fibonacci Retrace, since inception, we see a 61.8% Fib level which remains unbroken, at $5.96. I expect strong resistance at this level, despite the potential short term Head and Shoulders Pattern. As the market continues to be oversold, look for a bullish divergence to appear. My opinion, which is strictly my own, is that this stock becomes a good buy between $5.50-$6.00.
Take a look at the past. Draw a quick Fibonacci chart for the first great gain. What does it do? It retraces all the way back to the 61.8%, just as it is currently. Afterwards, it skyrockets back up to the 88% Fibonacci Extension level, and starts consolidating for the next move.
This will reverse and bounce, and either retrace back to the original neckline before coming back down, or will rocket past and upwards to the 88%, 100% level.
