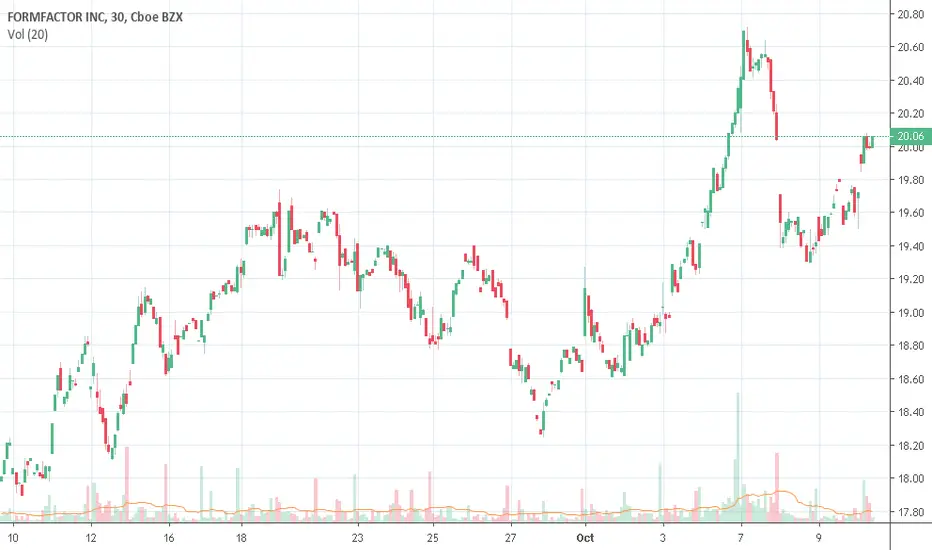
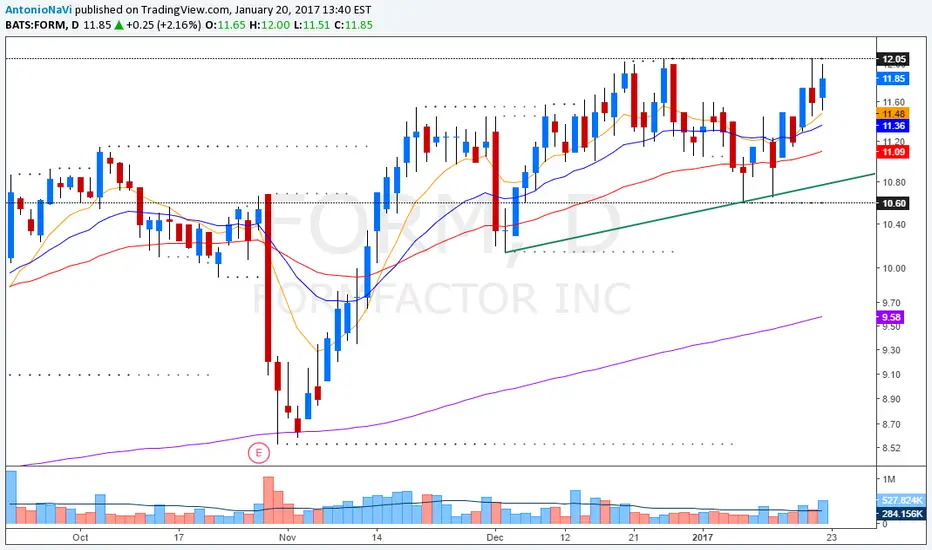
$FORM Bullish Breakout Over Flag PatternTechnical Setup
FormFactor has been one of the stronger-performing stocks of 2026. After reporting earnings beat, the stock saw a modest pullback that appears to have formed a bull flag pattern.
The stock held its 21 EMA during the pullback and appears to be breaking out of the flag formation. This
FormFactor, Inc.
No trades
Next report date
—
Report period
—
EPS estimate
—
Revenue estimate
—
0.88 USD
54.36 M USD
784.99 M USD
77.34 M
About FormFactor, Inc.
Sector
Industry
CEO
Michael D. Slessor
Website
Headquarters
Livermore
Founded
1993
IPO date
Jun 12, 2003
Identifiers
3
ISIN US3463751087
FormFactor, Inc. engages in the provision of test and measurement solutions. It operates through the Probe Cards and Systems segments. The Probe Cards segment consists of technologies and product architectures, including micro-electromechanical systems technologies. The Systems segment consists of analytical probe solutions for on-wafer probing, board tests, and package tests. The company was founded by Igor Khandros on April 15, 1993 and is headquartered in Livermore, CA.
Related stocks
FORM | 26' Q2 | Day ChartPEGY ratio says this stock is potentially undervalued.
looking at entry
** T.A explained **
Multiple Time-Frame Analysis; Color Code | Strength favors the higher timeframe.
Yearly timeframe = black
Monthly timeframe = pink
weekly = grey
daily = red
4hr = orange
1hr = yellow
15min = blue
5min = gre
FORM wave count FORM remains in a strong higher-timeframe uptrend, and my current wave count treats the recent pullback as a potential wave (4) correction inside the larger wave 5 advance. After breaking above the prior 106 area, price accelerated into the 159 resistance / 0.5 Fib extension zone, where supply appea
FORM – 30-Min Long Trade Setup !📈 🟢
🔹 Asset: FormFactor, Inc. (FORM – NASDAQ)
🔹 Timeframe: 30-Min Chart
🔹 Setup Type: Falling Wedge Breakout + Retest Confirmation
📊 Trade Plan – Long Position
✅ Entry Zone: $27.15 (Breakout + Retest Entry)
✅ Stop-Loss (SL): $26.11 (Below wedge + structural support)
🎯 Take Profit Targets:
📌 TP1: $
Cup & Handle Pattern confirmed?I originally bought this stock early in 2019 thinking it was breaking out of the same pattern I'm illustrating now so I could be wrong again (I'm not buying more here), but I held through that initial shakeout and continue to hold and am encouraged by the recent price action in this stock. (I hold
FORM MA Convergence Divergence MACD Histogram turned positiveThis is a Bullish indicator signaling FORM's price could rise from here. You may explore going long the stock or buying call options. I identified 49 similar cases where FORM's MACD histogram became positive, and 41 of them led to successful outcomes. Odds of Success: 84%.
See all ideas
Summarizing what the indicators are suggesting.
Neutral
SellBuy
Strong sellStrong buy
Strong sellSellNeutralBuyStrong buy
Neutral
SellBuy
Strong sellStrong buy
Strong sellSellNeutralBuyStrong buy
Neutral
SellBuy
Strong sellStrong buy
Strong sellSellNeutralBuyStrong buy
An aggregate view of professional's ratings.
Neutral
SellBuy
Strong sellStrong buy
Strong sellSellNeutralBuyStrong buy
Neutral
SellBuy
Strong sellStrong buy
Strong sellSellNeutralBuyStrong buy
Neutral
SellBuy
Strong sellStrong buy
Strong sellSellNeutralBuyStrong buy
Displays a symbol's price movements over previous years to identify recurring trends.
Frequently asked questions
The current price of FORM is 126.27 USD — it has decreased by −1.34% in the past 24 hours. Watch FormFactor, Inc. stock price performance more closely on the chart.
Depending on the exchange, the stock ticker may vary. For instance, on NASDAQ exchange FormFactor, Inc. stocks are traded under the ticker FORM.
FORM stock has fallen by −15.48% compared to the previous week, the month change is a 0.49% rise, over the last year FormFactor, Inc. has showed a 282.87% increase.
We've gathered analysts' opinions on FormFactor, Inc. future price: according to them, FORM price has a max estimate of 175.00 USD and a min estimate of 118.00 USD. Watch FORM chart and read a more detailed FormFactor, Inc. stock forecast: see what analysts think of FormFactor, Inc. and suggest that you do with its stocks.
FORM reached its all-time high on Apr 24, 2026 with the price of 159.09 USD, and its all-time low was 3.70 USD and was reached on Nov 16, 2012. View more price dynamics on FORM chart.
See other stocks reaching their highest and lowest prices.
FORM stock is 7.28% volatile and has beta coefficient of 1.93. Track FormFactor, Inc. stock price on the chart and check out the list of the most volatile stocks — is FormFactor, Inc. there?
Today FormFactor, Inc. has the market capitalization of 9.84 B, it has decreased by −8.65% over the last week.
Yes, you can track FormFactor, Inc. financials in yearly and quarterly reports right on TradingView.
FormFactor, Inc. is going to release the next earnings report on Aug 5, 2026. Keep track of upcoming events with our Earnings Calendar.
FORM earnings for the last quarter are 0.56 USD per share, whereas the estimation was 0.44 USD resulting in a 27.18% surprise. The estimated earnings for the next quarter are 0.61 USD per share. See more details about FormFactor, Inc. earnings.
FormFactor, Inc. revenue for the last quarter amounts to 226.14 M USD, despite the estimated figure of 225.54 M USD. In the next quarter, revenue is expected to reach 240.00 M USD.
FORM net income for the last quarter is 20.38 M USD, while the quarter before that showed 23.22 M USD of net income which accounts for 0.00% change. Track more FormFactor, Inc. financial stats to get the full picture.
No, FORM doesn't pay any dividends to its shareholders. But don't worry, we've prepared a list of high-dividend stocks for you.
As of May 17, 2026, the company has 2.15 K employees. See our rating of the largest employees — is FormFactor, Inc. on this list?
EBITDA measures a company's operating performance, its growth signifies an improvement in the efficiency of a company. FormFactor, Inc. EBITDA is 127.59 M USD, and current EBITDA margin is 14.16%. See more stats in FormFactor, Inc. financial statements.
Like other stocks, FORM shares are traded on stock exchanges, e.g. Nasdaq, Nyse, Euronext, and the easiest way to buy them is through an online stock broker. To do this, you need to open an account and follow a broker's procedures, then start trading. You can trade FormFactor, Inc. stock right from TradingView charts — choose your broker and connect to your account.
Investing in stocks requires a comprehensive research: you should carefully study all the available data, e.g. company's financials, related news, and its technical analysis. So FormFactor, Inc. technincal analysis shows the neutral today, and its 1 week rating is buy. Since market conditions are prone to changes, it's worth looking a bit further into the future — according to the 1 month rating FormFactor, Inc. stock shows the buy signal. See more of FormFactor, Inc. technicals for a more comprehensive analysis.
If you're still not sure, try looking for inspiration in our curated watchlists.