Intuit (INTU): A High-Quality Franchise Facing an AI Era RepriciExecutive Summary:
Margin of safety verdict: At roughly $398 per share, Intuit appears to be a high-quality business trading near a reasonable value but without a clearly demonstrable 20 percent margin of safety.
Intuit has built one of the most durable franchises in financial software. Its ecosyst
Next report date
—
Report period
—
EPS estimate
—
Revenue estimate
—
15.53 USD
3.87 B USD
18.83 B USD
270.59 M
About Intuit Inc.
Sector
Industry
CEO
Sasan K. Goodarzi
Website
Headquarters
Mountain View
Founded
1983
IPO date
Mar 12, 1993
Identifiers
3
ISIN US4612021034
Intuit, Inc. engages in the provision of business and financial management solutions. It operates through the following segments: Small Business and Self-Employed, Consumer, Credit Karma, and ProTax. The Small Business and Self-Employed segment offers QuickBooks financial and business management online services and desktop software, payroll solutions, payment processing solutions, and financing for small businesses. The Consumer segment includes do-it-yourself and assisted TurboTax income tax preparation products and services. The Credit Karma segment serves consumers with a personal finance platform that provides personalized recommendations of credit cards, home, auto and personal loans, and insurance products, and online savings and checking accounts. The ProTax segment refers to the professional accountants in the U.S. and Canada, who are essential to both small business success and tax preparation and filing. The company was founded by Scott D. Cook and Thomas A. Proulx in March 1983 and is headquartered in Mountain View, CA.
Related stocks
INTU rebound setup as buyers defend post-selloff base:Current Price: 439.96
Direction: LONG
Confidence level: 58%(Limited direct trader commentary but improving price structure, stabilization after a sharp selloff, and supportive analyst targets justify a cautious long bias.)
Targets
Target 1: 460.0
Target 2: 485.0
Stop Levels
Stop 1: 425.0
Stop 2
Parabolic Bounce Target That Doesn't Match the Signal StackPrice is at 465.17, sitting at 33% of its historical range between 357.5 and 683.43. The system reads Flat Bear at 1.22% edge — essentially neutral with a marginal bear lean. Signal count is 26 green vs 31 red out of 112. The spread is 8.8% Tight, confirming the market genuinely cannot decide direct
Intuit | INTU | Long at $350.00Intuit NASDAQ:INTU (QuickBooks, TurboTax, Mailchimp, Credit Karma, etc) has officially entered my "crash" simple moving average area (green lines). While the price may hold up in the near-term around this area and eventually move higher, I suspect there could be weakness down into the "major crash
Intuit (INTU) — Quick Recap • Price: ~$389 • Trailing EPS: ~$1Intuit (INTU) — Quick Recap
• Price: ~$389
• Trailing EPS: ~$10.6
• Current P/E: ~36–37x → still above its long-term average (~33x), so not cheap yet.
Technical Picture
• The stock broke its 2023–2025 uptrend and is in a valuation reset phase, not a normal pullback.
• Price has returned to a m
$INTU losing 200 day weekly average after 2009- NASDAQ:INTU has never lost 200 days weekly average for the first time in last 17 years.
- It went below 200 days weekly average for small stint only to capture it back.
- It appears that this time it has a clean breakdown most likely because of claude co-work which has sparked great exodus from
See all ideas
Summarizing what the indicators are suggesting.
Neutral
SellBuy
Strong sellStrong buy
Strong sellSellNeutralBuyStrong buy
Neutral
SellBuy
Strong sellStrong buy
Strong sellSellNeutralBuyStrong buy
Neutral
SellBuy
Strong sellStrong buy
Strong sellSellNeutralBuyStrong buy
An aggregate view of professional's ratings.
Neutral
SellBuy
Strong sellStrong buy
Strong sellSellNeutralBuyStrong buy
Neutral
SellBuy
Strong sellStrong buy
Strong sellSellNeutralBuyStrong buy
Neutral
SellBuy
Strong sellStrong buy
Strong sellSellNeutralBuyStrong buy
Displays a symbol's price movements over previous years to identify recurring trends.
Frequently asked questions
The current price of INTU is 393.00 USD — it has increased by 3.89% in the past 24 hours. Watch Intuit Inc. stock price performance more closely on the chart.
Depending on the exchange, the stock ticker may vary. For instance, on NASDAQ exchange Intuit Inc. stocks are traded under the ticker INTU.
INTU stock has fallen by −0.64% compared to the previous week, the month change is a 4.80% rise, over the last year Intuit Inc. has showed a −39.94% decrease.
We've gathered analysts' opinions on Intuit Inc. future price: according to them, INTU price has a max estimate of 916.00 USD and a min estimate of 350.00 USD. Watch INTU chart and read a more detailed Intuit Inc. stock forecast: see what analysts think of Intuit Inc. and suggest that you do with its stocks.
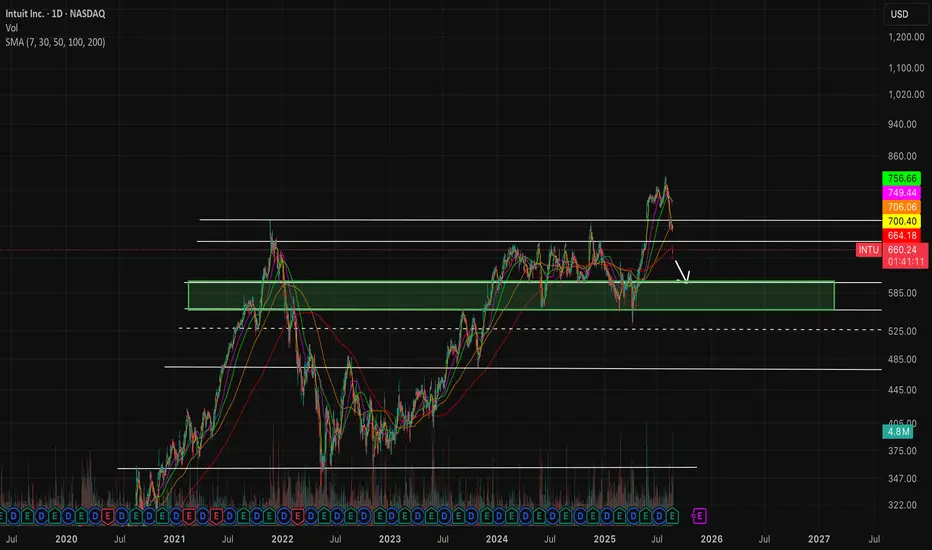
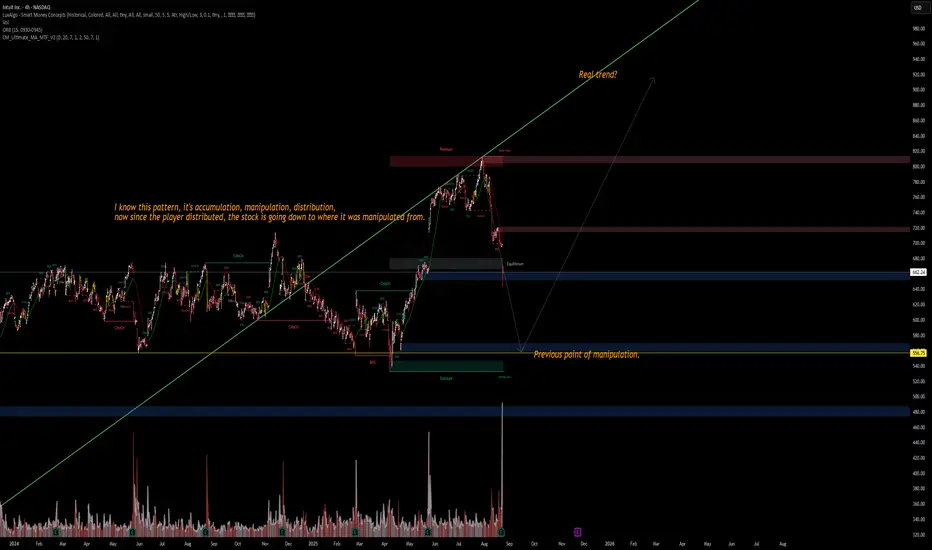
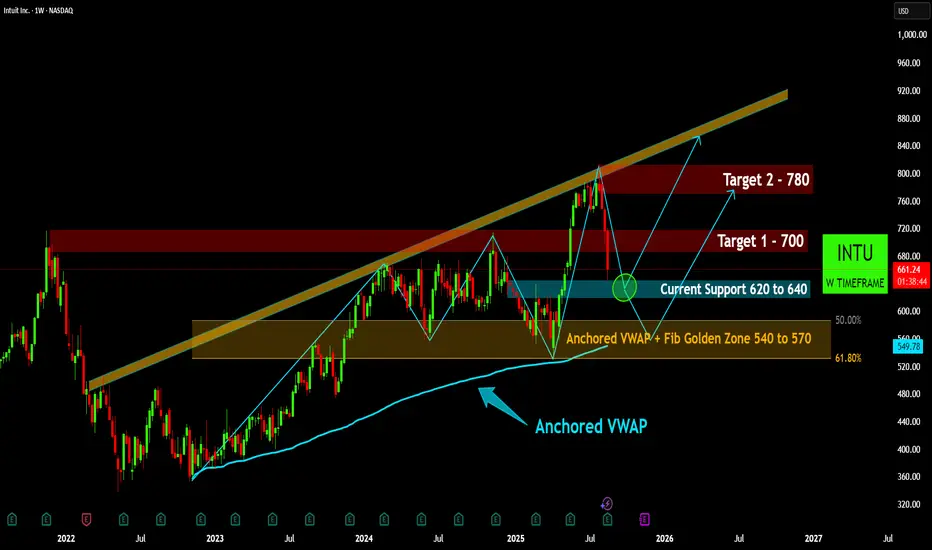
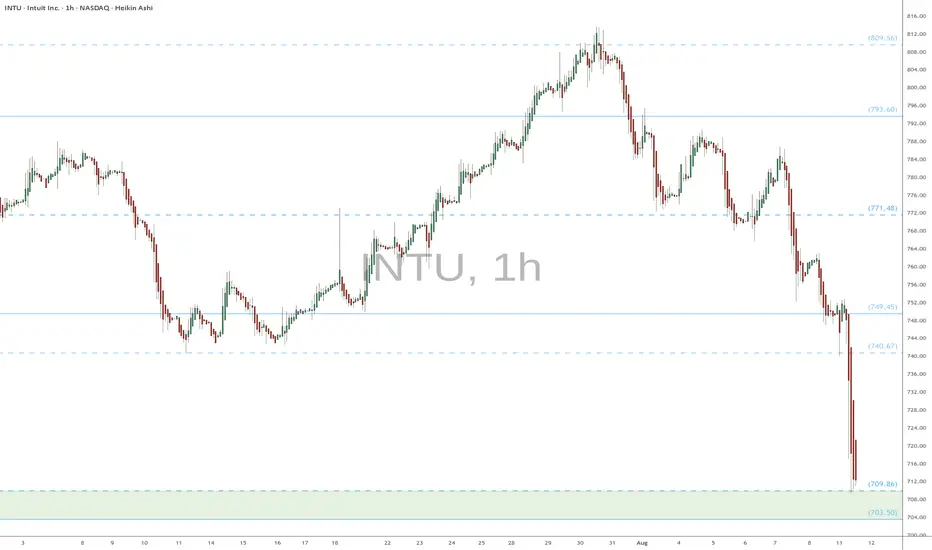
INTU reached its all-time high on Jul 30, 2025 with the price of 813.70 USD, and its all-time low was 2.00 USD and was reached on Apr 21, 1993. View more price dynamics on INTU chart.
See other stocks reaching their highest and lowest prices.
INTU stock is 5.49% volatile and has beta coefficient of 0.31. Track Intuit Inc. stock price on the chart and check out the list of the most volatile stocks — is Intuit Inc. there?
Today Intuit Inc. has the market capitalization of 108.68 B, it has increased by 3.07% over the last week.
Yes, you can track Intuit Inc. financials in yearly and quarterly reports right on TradingView.
Intuit Inc. is going to release the next earnings report on May 20, 2026. Keep track of upcoming events with our Earnings Calendar.
INTU earnings for the last quarter are 4.15 USD per share, whereas the estimation was 3.68 USD resulting in a 12.64% surprise. The estimated earnings for the next quarter are 12.57 USD per share. See more details about Intuit Inc. earnings.
Intuit Inc. revenue for the last quarter amounts to 4.65 B USD, despite the estimated figure of 4.53 B USD. In the next quarter, revenue is expected to reach 8.54 B USD.
INTU net income for the last quarter is 693.00 M USD, while the quarter before that showed 446.00 M USD of net income which accounts for 0.00% change. Track more Intuit Inc. financial stats to get the full picture.
Yes, INTU dividends are paid quarterly. The last dividend per share was 1.20 USD. As of today, Dividend Yield (TTM)% is 1.18%. Tracking Intuit Inc. dividends might help you take more informed decisions.
Intuit Inc. dividend yield was 0.53% in 2025, and payout ratio reached 30.43%. The year before the numbers were 0.56% and 34.51% correspondingly. See high-dividend stocks and find more opportunities for your portfolio.
As of May 18, 2026, the company has 18.2 K employees. See our rating of the largest employees — is Intuit Inc. on this list?
EBITDA measures a company's operating performance, its growth signifies an improvement in the efficiency of a company. Intuit Inc. EBITDA is 6.28 B USD, and current EBITDA margin is 30.52%. See more stats in Intuit Inc. financial statements.
Like other stocks, INTU shares are traded on stock exchanges, e.g. Nasdaq, Nyse, Euronext, and the easiest way to buy them is through an online stock broker. To do this, you need to open an account and follow a broker's procedures, then start trading. You can trade Intuit Inc. stock right from TradingView charts — choose your broker and connect to your account.
Investing in stocks requires a comprehensive research: you should carefully study all the available data, e.g. company's financials, related news, and its technical analysis. So Intuit Inc. technincal analysis shows the sell today, and its 1 week rating is sell. Since market conditions are prone to changes, it's worth looking a bit further into the future — according to the 1 month rating Intuit Inc. stock shows the sell signal. See more of Intuit Inc. technicals for a more comprehensive analysis.
If you're still not sure, try looking for inspiration in our curated watchlists.