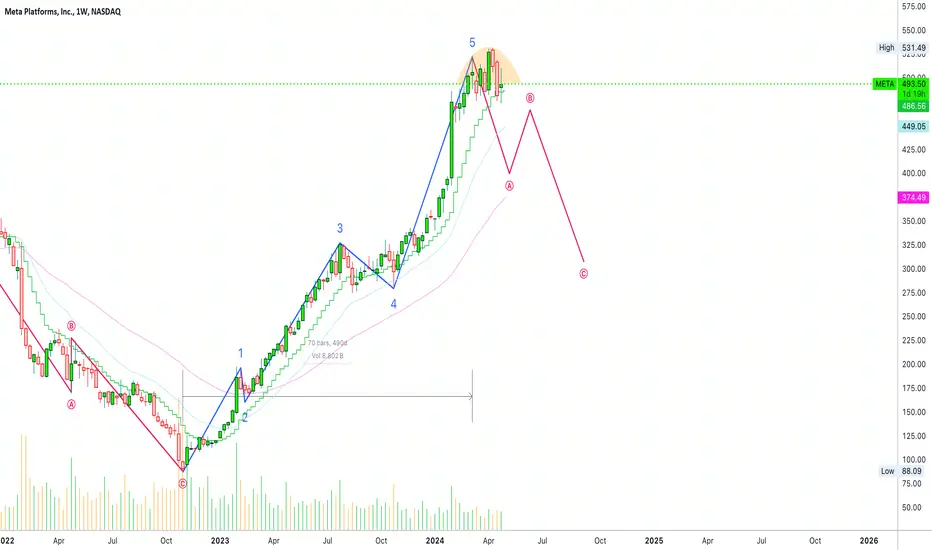
$META it was fun while it lasted. Sub $300 coming soon.NASDAQ:META had a good run, but now that run is coming to an end.
I started buying puts today when price was at $524. I bought 6/21 $300P. There's a chance price could break the current highs, but it wouldn't change my bias.
I think starting later this month, we're going to start to see a large m
What's happening today with Meta Platforms
- •KGI Securities cut Meta Platforms' price target from $565 to $550. Analysts see it as outperform, with targets between $400-$600.
Next report date
Report period
Q2 2024
EPS estimate
4.69USD
Revenue estimate
38.19 BUSD
17.85USD
39.10 BUSD
134.90 BUSD
2.18 B
About Meta Platforms
Sector
Industry
CEO
Mark Elliot Zuckerberg
Website
Headquarters
Menlo Park
Employees (FY)
67.32 K
Founded
2004
FIGI
BBG000MM2P62
Meta Platforms, Inc., engages in the development of social media applications. It builds technology that helps people connect, find communities, and grow businesses. It operates through the Family of Apps (FoA) and Reality Labs (RL) segments. The FoA segment consists of Facebook, Instagram, Messenger, WhatsApp, and other services. The RL segment includes augmented and virtual reality related consumer hardware, software, and content. The company was founded by Mark Elliot Zuckerberg, Dustin Moskovitz, Chris R. Hughes, Andrew McCollum, and Eduardo P. Saverin on February 4, 2004, and is headquartered in Menlo Park, CA.

Meta Platforms - Watch the earnings!Hello Traders and Investors, today I will take a look at Meta Platforms.
--------
Explanation of my video analysis:
For more than five years Meta Platforms has been trading in a reverse symmetrical triangle formation. We saw the last retest of support back in the end of 2022 which was followed

📉 Meta Completes Bullish ImpulseI can spot a perfect 5-up wave pattern from October 2022 through March 2024. A correction is likely to follow next.
On the chart we have a classic Zig-zag (ABC) correction (5-3-5) but any type of correction can develop. It can be flat, complex, extended, irregular, etc.
There is always the possibi
META gap supportRSI divergence for last two peaks.
RSI not over sold yet.
Before the earnings #META might test gap support 450 ish

META Share Price Collapses after Publication of Quarterly ReportMETA Share Price Collapses after Publication of Quarterly Report
Just yesterday, META's stock price closed at USD 493.50, up approximately 40% since the start of 2024 and up nearly 300% since the start of 2023.
However, following the release of Meta's quarterly report, its shares plummeted to USD

(NASDAQ:META) STOCK FORECAST PLUNGING BELOW $400.00 THIS WEEK!!!GAP FILLING PHENOMENON!!
1. Immediate Bearish Outlook: Meta's stock is expected to experience a significant downturn, with projections indicating a drop below $400.00 within the current week. This decline is attributed to an earnings report, which could trigger a 20% decrease and result in Gap #

Meta Meta is looking like its in phase c of a #wyckoff Distribution top. A Large Ripsaw is at play with a low at 70. #meta NASDAQ:META #facebook #stockmarket #investor

Meta grabbing liquidity from Supply zone .Meta grabs liquidity from Buyers at Supply zone then enters a range for S&D zone , for now its at Discount Price Range good long reversal expected unless theres not enough liquidity and create Trend Change to Short

$META Implied Move for earningsNASDAQ:META Implied move for earnings today... 452 - 538 ... this is not a full analysis, just what the options are saying for the earnings move!! GL y'all...

Will Mark Zuckerberg Become The Wealthiest Person In The World It's gone 12 months or so since Meta Platforms shareholders reached their breaking point in Q4'22 as the Tech giant's financial results in those times were following an increasingly questionable rebrand, from Facebook into Meta.
In October, 2022 Altimeter Capital Chairman and CEO Brad Gerstner said

See all ideas
Trade directly on the supercharts through our supported, fully-verified and user-reviewed brokers.


Curated watchlists where META is featured.


Frequently Asked Questions
The current price of META is 443.29 USD — it has increased by 0.43% in the past 24 hours.
Depending on the exchange, the stock ticker may vary. For instance, on NASDAQ exchange Meta Platforms stocks are traded under the ticker META.
Meta Platforms is going to release the next earnings report on Jul 24, 2024. Keep track of upcoming events with our Earnings Calendar.
META stock is 3.35% volatile and has beta coefficient of 1.22. Check out the list of the most volatile stocks — is Meta Platforms there?
META earnings for the last quarter are 5.33 USD per share, whereas the estimation was 4.82 USD resulting in a 10.54% surprise. The estimated earnings for the next quarter are 4.32 USD per share. See more details about Meta Platforms earnings.
Meta Platforms revenue for the last quarter amounts to 40.11 B USD despite the estimated figure of 39.12 B USD. In the next quarter revenue is expected to reach 36.15 B USD.
Yes, you can track Meta Platforms financials in yearly and quarterly reports right on TradingView.
META stock has fallen by 11.84% compared to the previous week, the month change is a 11.22% fall, over the last year Meta Platforms has showed a 84.79% increase.
META net income for the last quarter is 12.37 B USD, while the quarter before that showed 14.02 B USD of net income which accounts for −11.76% change. Track more Meta Platforms financial stats to get the full picture.
Today Meta Platforms has the market capitalization of 1.12 T, it has decreased by 3.61% over the last week.
Yes, META dividends are paid quarterly. The last dividend per share was 0.50 USD. As of today, Dividend Yield (TTM)% is 0.11%. Tracking Meta Platforms dividends might help you take more informed decisions.
Like other stocks, META shares are traded on stock exchanges, e.g. Nasdaq, Nyse, Euronext, and the easiest way to buy them is through an online stock broker. To do this, you need to open an account and follow a broker's procedures, then start trading. You can trade Meta Platforms stock right from TradingView charts — choose your broker and connect to your account.
As of Apr 27, 2024, the company has 67.32 K employees. See our rating of the largest employees — is Meta Platforms on this list?
Investing in stocks requires a comprehensive research: you should carefully study all the available data, e.g. company's financials, related news, and its technical analysis. So Meta Platforms technincal analysis shows the sell today, and its 1 week rating is neutral. Since market conditions are prone to changes, it's worth looking a bit further into the future — according to the 1 month rating Meta Platforms stock shows the buy signal. See more of Meta Platforms technicals for a more comprehensive analysis.
If you're still not sure, try looking for inspiration in our curated watchlists.
If you're still not sure, try looking for inspiration in our curated watchlists.
We've gathered analysts' opinions on Meta Platforms future price: according to them, META price has a max estimate of 600.00 USD and a min estimate of 400.00 USD. Read a more detailed Meta Platforms forecast: see what analysts think of Meta Platforms and suggest that you do with its stocks.
EBITDA measures a company's operating performance, its growth signifies an improvement in the efficiency of a company. Meta Platforms EBITDA is 69.83 B USD, and current EBITDA margin is 45.50%. See more stats in Meta Platforms financial statements.