NEARUSDT.P trade ideas


NearIt is not a trade offer. It is only a possibility. In this market, luck favors those who have access to the news earlier

NRARUSDT - 1h Micro Long Signal💡#MICRO_SIGNAL 💡
NEAR / USDT
Lv - x3
▶️ Buy 2 Line
🔴 SLT - 1h (trigger)
At a strong level, a good pattern. Of course, this is not enough for a global upward turn, but you can trade locally.
#NEARUSDT_1h_150922


NEARUSD LONGPossible upward movement of the pair. Price is currently in a lower bound trading zone of a range with significant volume making stops and holding rejections at the bottom of the price in an area near the 55 period EMA , essential in my strategy for analysis of possible trend continuations. Indicators like Squeeze Momentum and the MACD histogram have turned bullish after their red valley; accompanied by the loss of bearish strength indicated by the ADX rebounding towards the EMA . The MACD lines would be giving a possible buy signal soon. I think it could go in search of the previous high price zone but it is unlikely to go higher as it runs into weak indications on the 4hr chart in a possible range. We are in a range zone, we will try to enter from the bottom to the top.

✅ NEAR fall to the biggest support! Long then?Hi friends! The whales make a trap pushing a Near price higher. After this bought they Near 10% lower. The volume bars confirm it for us. Nice profit.
What is the highest possible scenario now? Near fall to the biggest $0.41-0.45 value area and the bottom border of the channel. So what does it mean? Double support for the price.
But we can expect the same manipulation at the bottom of the channel by the whales. They must want to collect liquidity below the lower border. So it will be our chance to open the trade with the whales.
📊 Preconditions to open the long:
🔥 liquidity collection (trap) at the bottom of the channel
🔥 volume growth. Pay your attention to the volume indicator which confirms you the pressence of buyer. Almost 7-8 times they accumulate NEAR at the bottom. Hope it will happen this time
🔥 DOM and Footprint shows us the real whales orders to BUY during the manipulations
🔥 bullish BTC of course
🚩 DOM and Footprint are the tools that i use for scalping. They help me to identify the best places to buy and sell crypto with the whales. Everyone can use because it`s avaliable for free.
📊 The targets: ,
1. $5 - the key level and huge resistance
2. $6.1 - the key level and local high
💻Friends, press the "boost"🚀 button, write comments and share with your friends - it will be the best THANK YOU.
P.S. Personally, I open an entry if the price shows it according to my strategy.
Always do your analysis before making a trade.

NEAR | The breakthrough is imminent.NEAR 1h time frame analysis. From the chart, we can see that NEAR price has formed a descending channel in the short term. But please note that the negative line is prevalent and longer than the positive line. In the first hour, the price fluctuated wildly.
Look for NEAR to break through EMA 20 and return to the top of the channel. The next step, is above Fib 0.5.
If you like and support our analysis, please give us a like and leave your comment. 😘
Good luck~☘

NEARUSD SHORTPossible downward movement of the step the price is currently in a zone of negotiations with important volume maintaining an important stop near the EMA of 55 fundamental periods in my strategy for the analysis of possible continuations of trend. I see a pattern known in my strategy as an ABC pattern, which indicates a range close to the EMA , for a possible continuation of the downward trend, in this case, through its wave C. We see the accompaniment of indicators such as the Squeeze Momentum and MACD histogram with negative directionality accompanied by the loss of strength of the previous movement to the upside in robot, indicated by the ADX. We see a possible selling pattern in the MACD lines. In one-hour timeframes we see important rejections close to the 55-period Ema , also being in a trading area with significant volume and possible patterns for a sell signal. I think it is quite possible to move down with a break of previous lows and continue its trend. The development of the pattern will be seen.

NEAR/USDT is under pressureHey hey
Last coin for today is going to be NEAR Protocol. After almost 10% drop NEAR has entered correctional zone and stopped for some time. As we can see there is not much of a volume as well sos we see that is might go for another drop! Our major confirmation would be if 4hr candle will be secured under that correctional zone. What are your thought about this coin?
If you like ideas provided by our team you can show us your support by liking and commenting.
Yours Sincerely,
Swallow Team 🔱
Disclamer:
We are not financial advisors. The content that we share on this website are for educational purposes and are our own personal opinions!

TRADE PLAN FOR NEAR FOR PROFITShello traders, find attached the trade plan for Near , we are expecting a continuation to the upside short term.
tradehubng

NEARUSDT sk analysis buying signalMarket in our Bc blue buying zone also after reaching the yellow sequence its target , bulls is on a very good buying area which give good potential for raising the market RR 2.13:1


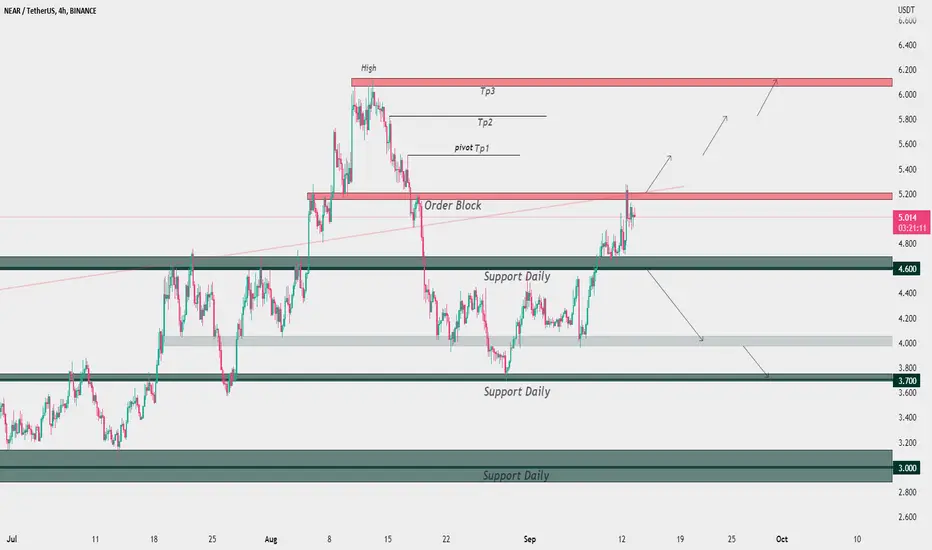
NEAR/USDT UPDATE In 4 Hour 😊👍Hello 🌟🚀
NEAR cryptocurrency was able to react to its $5.2 target. ✔
If it stabilizes above the range of $5.2 (Order block), it has the ability to realize the levels of $5.5, $5.8 and the resistance area of $6.
Otherwise, with the loss of the daily support area of $4.6, the price is expected to react to the level of $4 and the support area of $3.7.
ArzToday Team 🌈
NEARUSDT TARGET 1 ✅ As we predicted, our pattern played out perfectly and NEAR pumped significiently. The first target gets smashed. Sell 50%-75% here and hold the rest of the volume.

NEAR - LONGNear on trend line 4h, after retracement to 0.618 Fib-level. Short time trade and hope the bounce to the upside. Trendline also act as support and show the direction on the way up.

NEAR entering resistance zone, can it blast through❔in my analysis posted in late august I pointed out white the trend support zone, pointed out how it was not logical to be bearish unless it broke.
as expected, we saw a big bounce from this level, congrats to longs.
now entering resistance zone which use to act as a strong support, this can play out two ways in my opinion.
scenario 1: rally to 5.5-6.4, then rejection back to trend support zone
scenario 2: break past 6.47, then parabolic rally to 10-12 levels.
drop boost and follow for more, thanks 💙

NEAR 1D testing the topBreaking the 0.618 Fibonacci ($5.19) level, high chances to retest the top of the previous move: $6.00 - $6.10.

NEARthe price rose to the upper border of the wedge and a strong resistance zone. I expect a correction to the area of strong support. In the case of a powerful pump, the price can rise to $6

NEARUSDT sk analysis buying signalMarket is on the way to our blue BC buying zone after the unfinished bulls blue sequence RR: 2.77:1 this analysis is based on SK strategy


NEARUSDT | PARALLEL CHANNELNEARUSDT is trading within a parallel channel . The price has printed multiple bearish candles near the confluence zone of upper boundary of channel and 0.50 fib level.
The bulls need to break above the channel and to hold above the 0.50 fib level. While bears are active below the upper boundary of the channel.
Trade your levels accordingly.
