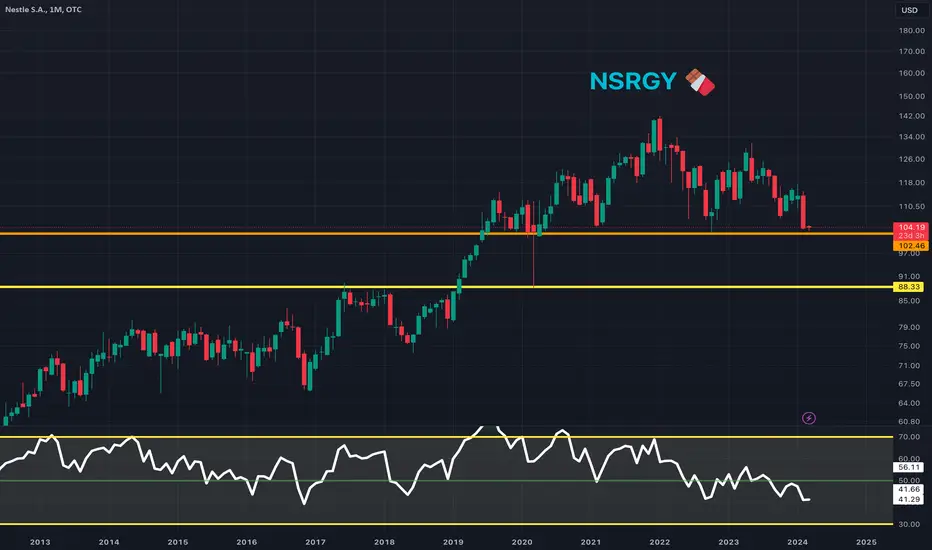
NSRGY Approaching Key Buy LevelsNSRGY has experienced a sharp decline, and is currently approaching an orange support level at $102.46. There is one more greedy support level below, the yellow support line at $88.33. I would monitor $102.46 for a bounce here, and I don't think it is a bad idea to buy at $102.46. However, NSRGY is
Next report date
Report period
H1 2024
EPS estimate
2.62USD
Revenue estimate
49.67 BUSD
5.03USD
13.31 BUSD
110.46 BUSD
2.51 B
About NESTLE N
Sector
CEO
Ulf Mark Schneider
Headquarters
Vevey
Website
Employees (FY)
270 K
Founded
1866
ISIN
CH0038863350
FIGI
BBG000CDMFS9
Nestlé SA is a nutrition, health, and wellness company, which engages in the business of manufacturing, supplying, and producing prepared dishes and cooking aids, milk-based products, pharmaceuticals and ophthalmic goods, baby foods, and cereals. It operates through the following segments: Zone North America; Zone Europe; Zone Asia, Oceania, and Africa; Zone Latin America; Zone Greater China; Nestlé Health Science; and Nespresso. The company was founded by Henri Nestlé in 1866 and is headquartered in Vevey, Switzerland.
NESTLE: NEN STAR detected!NESTLE: NEN STAR detected!
monitor PRZ
EMA.200 monthly!!
Fibonacci Levels
Levelx ICHIMOKU

Nestle ongTaking small long position on Nestle based on mometum and volume trend reversal. Waiting on 3-day chart for confirmation before consideriing to add to my position.

short position on NESNMy strtegy is based on price action with the reading of certain indicators that I like whilerespecting all the values that define the stock maket

Nestle in key supportAll the red and bad news in the market make me think different.
SPY is slightly below a key level and Russel 2000 hit the 2020 pre covid high.
A bounce is very very possible here!


''NESN'' Time to Sellwe wait for the range break and after the confirmation we can take the sell position

Nestle Europe Sun Storm Investment Trading Desk & NexGen Wealth Management Service Present's: SSITD & NexGen Portfolio of the Week Series
Focus: Worldwide
By Sun Storm Investment Research & NexGen Wealth Management Service
A Profit & Solutions Strategy & Research
Trading | Investment | Stocks | ETF | Mutua

Bull Flag Continuation Breakout to ABCD Patter Completion ZoneWe have convincingly Broken out and closed above the consolidation point of a potential bull flag and we look to be getting ready to continue our ascent up to the D point of an even bigger ABCD Harmonic Move.

Working with anglesWorking with angles is something I see myself doing more often lately, meaning they have proven some reliability to me over time. When exactly is still quite intuitive and this publication is also an idea to further explore by other traders and so develop a competitive edge, and therefore should rem

See all ideas
Trade directly on the supercharts through our supported, fully-verified and user-reviewed brokers.


Curated watchlists where NSRGF is featured.


Frequently Asked Questions
The current price of NSRGF is 101.44 USD — it has increased by 0.35% in the past 24 hours. Watch Nestle S.A. stock price performance more closely on the chart.
Depending on the exchange, the stock ticker may vary. For instance, on OTC exchange Nestle S.A. stocks are traded under the ticker NSRGF.
Nestle S.A. is going to release the next earnings report on Jul 25, 2024. Keep track of upcoming events with our Earnings Calendar.
NSRGF stock is 1.18% volatile and has beta coefficient of 0.66. Track Nestle S.A. stock price on the chart and check out the list of the most volatile stocks — is Nestle S.A. there?
NSRGF earnings for the last quarter are 2.71 USD per share, whereas the estimation was 2.65 USD resulting in a 2.39% surprise. The estimated earnings for the next quarter are 3.04 USD per share. See more details about Nestle S.A. earnings.
Nestle S.A. revenue for the last quarter amounts to 51.70 B USD despite the estimated figure of 52.22 B USD. In the next quarter revenue is expected to reach 58.29 B USD.
Yes, you can track Nestle S.A. financials in yearly and quarterly reports right on TradingView.
NSRGF stock has risen by 2.44% compared to the previous week, the month change is a 3.03% fall, over the last year Nestle S.A. has showed a 22.31% decrease.
NSRGF net income for the last quarter is 6.60 B USD, while the quarter before that showed 6.31 B USD of net income which accounts for 4.69% change. Track more Nestle S.A. financial stats to get the full picture.
Today Nestle S.A. has the market capitalization of 257.38 B, it has increased by 0.45% over the last week.
Yes, NSRGF dividends are paid annually. The last dividend per share was 3.29 USD. As of today, Dividend Yield (TTM)% is 3.27%. Tracking Nestle S.A. dividends might help you take more informed decisions.
Nestle S.A. dividend yield was 3.08% in 2023, and payout ratio reached 70.82%. The year before the numbers were 2.75% and 86.14% correspondingly. See high-dividend stocks and find more opportunities for your portfolio.
Like other stocks, NSRGF shares are traded on stock exchanges, e.g. Nasdaq, Nyse, Euronext, and the easiest way to buy them is through an online stock broker. To do this, you need to open an account and follow a broker's procedures, then start trading. You can trade Nestle S.A. stock right from TradingView charts — choose your broker and connect to your account.
NSRGF reached its all-time high on Dec 30, 2021 with the price of 143.92 USD, and its all-time low was 0.05 USD and was reached on Oct 2, 2014. View more price dynamics on NSRGF chart.
See other stocks reaching their highest and lowest prices.
See other stocks reaching their highest and lowest prices.
As of May 3, 2024, the company has 270.00 K employees. See our rating of the largest employees — is Nestle S.A. on this list?
Investing in stocks requires a comprehensive research: you should carefully study all the available data, e.g. company's financials, related news, and its technical analysis. So Nestle S.A. technincal analysis shows the sell today, and its 1 week rating is sell. Since market conditions are prone to changes, it's worth looking a bit further into the future — according to the 1 month rating Nestle S.A. stock shows the sell signal. See more of Nestle S.A. technicals for a more comprehensive analysis.
If you're still not sure, try looking for inspiration in our curated watchlists.
If you're still not sure, try looking for inspiration in our curated watchlists.
We've gathered analysts' opinions on Nestle S.A. future price: according to them, NSRGF price has a max estimate of 135.54 USD and a min estimate of 92.36 USD. Watch NSRGF chart and read a more detailed Nestle S.A. stock forecast: see what analysts think of Nestle S.A. and suggest that you do with its stocks.
EBITDA measures a company's operating performance, its growth signifies an improvement in the efficiency of a company. Nestle S.A. EBITDA is 23.13 B USD, and current EBITDA margin is 20.94%. See more stats in Nestle S.A. financial statements.