NULSUSDT ANALYSISIn my opinion, after my analysis, the candles go up and down between the resistance line (0.9560) and the dashed line.
A good opportunity is buying at the dashed line and sell at the resistance line(0.9560)
If you have some concerns, please let me know!!
NULSUSDT trade ideas


NULSUSDT ❌ Nuls Proof of Bullish Reversal?...if Support is Held💬 The NULS + Nerve Network and Bitcoin staking services news is almost as bullish as the potential bullish reversal we are seeing on NULS's chart. Let's take a look at some different timeframes to see what NULS is up to.
Hit that 👍 button to show support for the content!
Help the community grow by giving us a follow 🐣
-----
Hourly Support:
S1: The S1 S/R flip has already acted as support, ideally once is enough and we start a move up from here. With that in mind, it may see a reaction again if retested so its worth having on the radar for that. Mostly though, this level is notable in being a key level to hold as you'll see as we move along with the analysis.
S2: S2 S/R flip is a likely support if the current move ends up being one of bearish continuation as shown by the downward ABC line. A move like that would show weakness in the higher timeframe market structure, so although the support is relevant, this sort of price structure is something to be cautious of.
Hourly Resistance:
R1: The R1 S/R flip will either act as resistance, bringing us downward, or as support if price can move above it. The bulls want to see it act as support as shown by the upward sloping "bullish reversal move" ABC line.
R2: The R2 S/R flip is where we expect a bullish reversal move to find resistance and reach a decision point.
-----
4 hour USDT:
The major price pivot point shown here is the level that the bulls must hold. If the bulls hold here, NULs has a long way to run. If the bulls can't hold, NULS shows real weakness. This is why we don't want a retest of S2 on the hourly, it jeopardizes this level.
-----
4 hour BTC:
4h BTC Support:
S1: The S1 orderblock lines up nicely with the USDT's S1. This makes this support even stronger and more ideal to hold.
S2: Again, we have an S2 support that could work like we explained with the USDT hourly S2, but retesting it isn't ideal (unless it is retested by BTC rapidly outpacing NULS... although that itself isn't the ideal for NULs bulls).
4h BTC Resistance:
R1: The R1 orderblock is the first point of resistance for BTC. Keep this one in mind if we do get a run.
R2: The same logic as R1, the R2 S/R flip will be a key resistance if and when it is tested.
-----
Summary:
NULS bulls want to see S1 hold. This is a rather important support to stay above, thus the clearest path is a bullish continuation from here as a show of strength. Although there is some local resistance, higher-timeframe resistance Is a good ways off. So if NULs can move here, it has a good amount of uptrend potential.
Resources:
www.businesswire.com
✨ Drop a comment asking for an update, we do NEW setups every day! ✨

NULSUSDT LONGBINANCE:NULSUSDT
price got bounce on 0.470 it very good to entry. target higher before.

NULS trying to make this resistance a support NULS trying to make this resistance a support here and jump up, ichimoku cloud color flipped already, and we are going through this one, and a nice cross as well inside of the cloud. i think it should be a good entry for a long position


NULS/USDT LONG POSITION#nuls looking good after it price confirms a clear breakout above the 0.45 resistance which is now acting as a support. i would start accumulating this coin from current price.

NULSUSDT - 2D chart, possible 140% upward moveBINANCE:NULSUSDT on the 2D chart
After a good run the price pulled back to the 2D 200-moving averages
Retrace looks complete
If the 200 MA/EMA holds as support, we can see a 140% move up in line with the original dominant trend
RSI is strong
2D double golden crosses (MA50/200 & EMA50/200) look imminent, just as they happened on the 1D chart as shown below
This is not a financial advice!!!


NULS: buying opportunityThe price could bounce on this major trendline and the uptrend could resume.

NULSUSDT - TA with a bit of imaginationHello Crypto Traders!
Support me by hitting the like & follow button
Nuls broke out of the downward channel and is IMO creating a inverse head and shoulders pattern. After the break of the neckline we can expect price to rise to given targets.
We need to break the 50 ema’s resistance to see continuation.


NULS/USDT - LONG - POTENTIAL 38%PAIR: NULS/USDT
T/F: 1HR
LENGTH: LONG
ENTRY: 0.5680
T1: 0.5960
T2: 0.6630
T3: 0.7150
T4: 0.7900
S/L: 0.5230
REASON:
- Resistance Break Up
- Trendline Break Up
- Potential S/R Flip
- Strong Uptrend
- Minimal recent resistance to break through
If you liked this idea, please like and subscribe to my profile.
TRADE WITH CAUTION & REMEMBER TO MANAGE YOUR TRADES AND STOP-LOSSES
This is not professional financial advice, just my thoughts and trades I am taking please trade safely and responsibly. Look after your portfolio and it will look after you.

NULSUSDTNULSUSDT, the trend has been increasing. Possible scenarios at this point;
1. It will reach the resistance line and break it above with an open-close candle. It is time to buy.
2. It might start to decrease, keep your eyes on each Fibonacci Levels, BUY at SUPPORTS, Sell at RESISTANCES.
Look at the Engineering Robo's signals how well works!!

NULSUSDT [84% LONG] - Target 1/3🚨TRADE SIGNAL🚨
NULSUSDT: Binance
- Enter after breakout
- First target of 3
✔️Entry Zone = 0.5340
💵Take Profit A = 0.6640 +24%
💵Take Profit B = 0.7967 +49%
💵Take Profit C = 0.9852 +84%
🛑 Stop Loss = 0.3672
-----------------------------------------------------------------
Please 👍 if you agree.
Follow 🔔 if you want more.
*Trade at your own risk,
I am not a financial advisor
Join the discussion

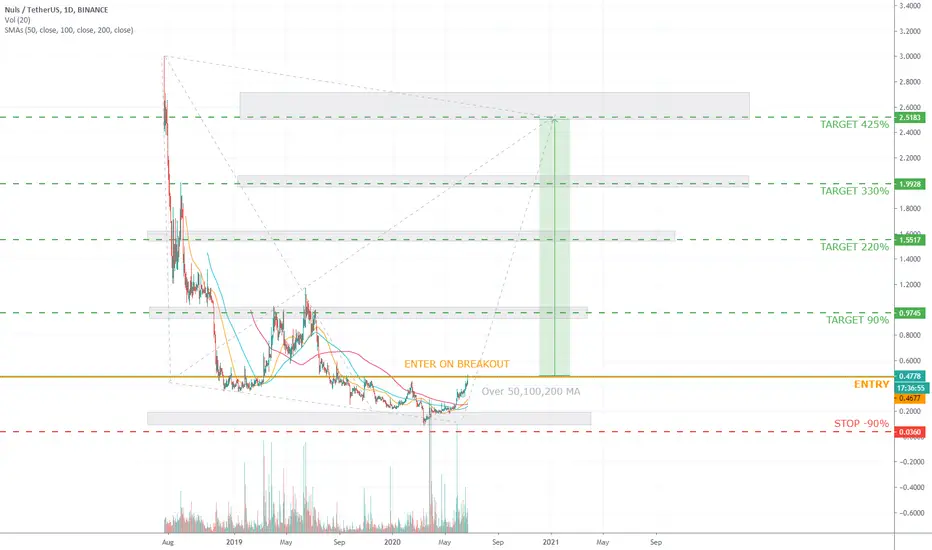
NULSUSDT [LONG +425%] 5M🚨ALTCOIN SEASON TRADE SIGNAL🚨
NULSUSDT: Binance
-Enter on breakout
-Price above 50, 100, 200ma
✔️Entry Zone = 0.00002650 - 0.00002653
💵Take Profit A = 0.9745 +90%
💵Take Profit B = 1.5520 +220%
💵Take Profit C = 1.9930 +330%
💵Take Profit D = 2.5185 +425%
🛑 Stop Loss = 0.4680 -6%
-----------------------------------------------------------------
Please 👍 if you agree.
Follow 🔔 if you want more.
*Trade at your own risk,
I am not a financial advisor
NULS/USDT (Bullish Pattern?)NULS/USDT
-still painting a bullish ascending triangle
-trading within the flat area of resistance
-the best strategy is to confirm an upside breakout
-enter Long if the candle closes bullish
-target the recent top at 0.4390s
-stoploss is below the 0.2250s


NULSUSDT bounce off of support, ready for upward movement It seems NULSUSDT is following a pattern were once a red candlestick touches the support there is price movement upwards. I’m expecting NULSUSDT to rise to around 24$ and I set it as the profit target. This will happen soon and be prepared for a rise. Even if it doesn’t hit 24$ it will definitely come close. Check out my other charts if you enjoyed this one.

Nuls USDT - Bull market Fib + elliot wave puntI like nuls historically for being a somewhat predictive trade versus others of similar market caps. This is a basic fib retracement + elliot wave recapture of the upper $1 range assuming we range and go up with bitcoin and not correct much from its current $9700 range. If btc ranges to $12k-$14k, this could likely regain $1.

NULS cup and handle + Bull flag!Nuls Bullish Flag
Today we trade like tip-toe...
Day to day? i develop my own work philosophy.
I wish to anyone to enjoy trading as i do.
I AM NOT A FINANCIAL ADVISER, DO YOUR OWN RESEARCH!
