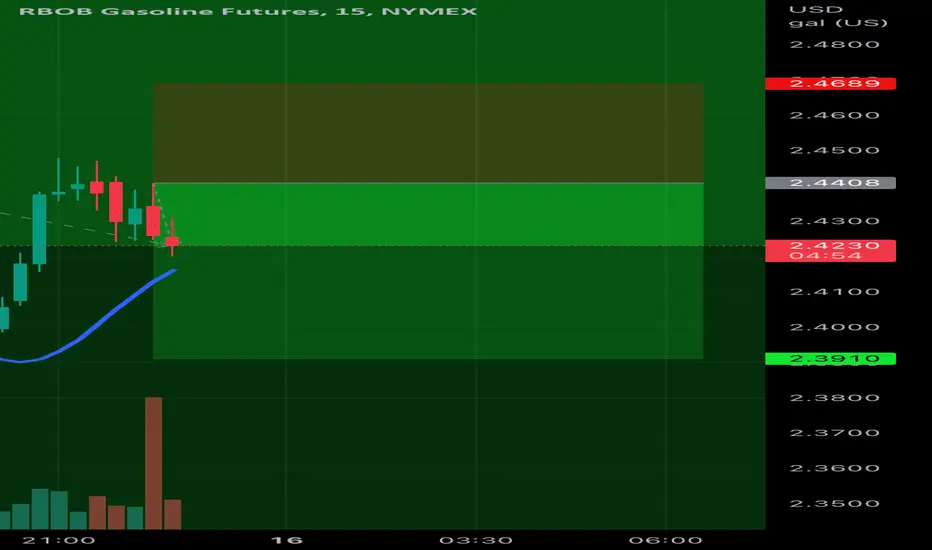
Gasolin short down to tuesdays high or start of last upmovewhen there is a rejection of a breakout (failing to close above a prior high)
my setup is to short down to prior breakout levels.
B7HK2013 trade ideas

Palladium still short and Gasoline/Crude Oil longnew short trades that might become swing trades: bitcoin and S&P 500 short

GASOLINE futures fall to 5-week low on low demand,high inventoryGasoline futures have dropped to a five-week low of $2.6 per gallon, primarily due to an unexpected increase in inventory and a decline in demand. Recent data from the Energy Information Administration (EIA) indicates a decrease in gas demand from 8.936 million to 8.519 million b/d last week. Moreover, the total domestic gasoline stock has increased by 1.3 million bbl, while markets had anticipated a draw of 1.267 million. Additionally, WTI crude prices have been falling since hitting a five-month high in April, amid concerns that a slowdown in global growth could dampen fuel demand. Furthermore, OPEC+ has announced a surprising reduction of output by 1.6 million barrels per day for the remainder of 2023, which may further impact fuel prices.
From a technical standpoint, the current price is within a bearish flag on a short continuation pattern. The next potential support area is at $2.0
If the price breaks the dynamic trendline of the channel, we may witness a further drop in gasoline prices.

RBOB Gasoline Future Macro Bearish 5-0Gasoline Futures is very near the PCZ of a Bearish 5-0 but is actually showing a very notable amount of weakness at the 0.382 and is Bearishly Diverging if this keeps up we will see Gasoline Breakdown out of the Bearish Consolidation and probably go back to pre-2020 Levels.

2023 Outlook: Is recession coming to town?After a turbulent 2022, there will be a lot of factors affecting the investment market in 2023. I have picked three most important ones to talk about.
• When will Fed stop hiking rate?
• Will there be a global recession?
• How could China’s reopening impact the market?
When will Fed stop hiking rate?
I respect Fed’s pivot table showing Fed Fund Rate will go up to 5.1%, but I don’t think it will go any higher, nor will it go below that level by the end of 2023. The pattern of interest rate hike could be (1) three 25 bp hikes or (2) one 50 bp followed by one 25bp. The market will cheer if the next hike in Feb is 25 bp since it opens the door for the terminal rate below 5%, but my assumption is on two hikes of 50 and 25 bp each that will end the hiking cycle by Q1.
Obviously, inflation peaked in US. Gas price had normalized and the drop in house price will eventually press the rent. The cash consumer accumulated during pandemic is exhausting and the layoff will make consumption more cautious. High base will also have a negative effect on annual inflation change. We will see inflation in a down trend in 2023, but we might not see the annual inflation rate drop to 2% target by end of the year. However, a “positive” real interest rate will allow the FED to stop hiking rate, especially the threat of recession is coming closer.
The Fed funds futures are currently reflecting differently and presenting a good opportunity to trade if 5% is the terminal rate by Q1. Short the April contract now helps express your market view in this scenario.
Will there be a recession?
YES, we will have a recession. The aggressive rate hikes by global central banks put a strong brake on economy growth. High interest rates stifled many lending activities, especially on high price tag items such as mortgage and car loan. Recession is also a self-fulfilling prophecy. When everyone is talking about recession, and your banker is telling you there will be recession, the preventative measure you taken will contribute to recession. Corporate will reduce capital expenses/investment and layoff people to reserve capital, and consumer will restrict spending to reserve cash flow. Not to mention the way the company handle the supply chain issue during pandemic is also back firing. Some companies expanded the capacity because there was a shortage, but this becomes excessive when activities return to normal. Semiconductor is a good example, and you can now easily get a PS5 without crazy markup.
The financial markets haven’t factored in the risk of recession, except the yield curve inversion. Stock market is still focusing on Fed policy and lacks enough attention on recession. We might have more recession discussion in Q1, which might offset some of the positive effect if Fed accomplished their mission. A recession might officially realize in the 2H 2023, which will have a material impact on company’s revenue and earnings. I don’t foresee a deep and prolonged recession, as the Fed has plenty of room to avoid it. Since stock market is forward-looking, we might see the lows of stock market in 1H, and some recovery in the 2H, but I don’t think we will revisit the new highs. After a significant underperformance in 2022, growth stock might perform better when the Fed stop hiking rate.
How could China’s reopening impact the market?
I am pessimistic on China’s economy. Reopening can end the pain but doesn’t mean the economy will see an immediate boost. The three-year covid zero restriction had already hurt the root of the economy and depleted most of the confidence and purchasing power of consumers, corporate and government. I don’t foresee same material “revenge consumption” happened in the west when the economy is reopened, since Chinese consumers didn’t receive cash from the government, nor any wealth effect from stock and property market. Chinese government is good at stimulating the economy by infrastructure investment, but not much on consumer demand. Even the government wants to do something, they will first need to find enough cash. Companies diversified their production line will not come back just because of the reopening since they already learned in the pandemic it is harmful to put all the eggs in one basket. Not to mention the fact that the political tension with US will make thing worse.
Comparatively, open-up is still better than lockdown, but the positive impact might be less than many expected. We might see some commodity prices such as crude oil and copper goes up because of the reopening, but the threat of global recession might offset some of the positive effect. Since China is now experiencing the peak of pandemic, we might have a clearer picture after Chinese New Year. We can use commodity price as leading indicators to access how strong the positive impact is.
Happy trading and wish you have a fruitful year of 2023.
Disclaimers
Above information are for illustration only and there is no guarantee on the accuracy of the information. They should not be treated as investment recommendations or advices.


RB1!HELLO GUYS THIS MY IDEA 💡ABOUT RB1! is nice to see strong volume area....
Where is lot of contract accumulated..
I thing that the buyers from this area will be defend this LONG position..
and when the price come back to this area, strong buyers will be push up the market again..
UP TREND + Resistance from the past + Strong volume area is my mainly reason for this long trade..
IF you like my work please like and follow thanks

RB Demand is down because inflation is up and people are driving less to make up for the cost.
Trend regression channel since Nov 04, 22
Entry 2.15
SL 2.21
TP 1.93

Bearish RBOB Gasoline Futures BearflagThis is kind of an extension to the US Crude-Oil Bearish Bat trade from the other day; So we have a Bear Flag on the Gasoline Futures chart and we seem to be confirming a Break Hook and Go that has room to take us to $2.00 if it holds.


Gasoline / US Dollar TIMEFIBSTimeFibs of the cycle 0-1. Consider the golden ratio of the time. Note that previous time Phi reversed the market. Let's see how the market reacts to 1/ Phi (1.618) Fibonacci is the order in chaos like a language of fractal. Dates of TimeFibs ratios as well as time periods are provided.
1.618 AT 6 OCT '22
Fibonacci channels Cover the Fractal Configuration of the waves of the cycle.
Note how when market is bearish Triple Cross UO turns red. Until the point where it gets closer to lower green dynamic band.
Try
I use this indicator to see the balance between Bulls and Bears in relation to each other.

Gasoline on the rise! Bullish CypherGasoline futures on the rise again as things heat up across the oil markets.
Bullish Cypher with a type 2 confirmation low.
Bullish divergence on the MACD, with a inverse head and shoulders style reversal on the RSI.
A common retracement here would be between the 382 and 618 at 2.91 - 3.40

Daily RB analysisDaily RB analysis
Sell trade with target and stop loss as shown in the chart
The trend is down and we may see more drop in the coming period in the medium term
All the best, I hope for your participation in the analysis, and for any inquiries, please send in the comments

RBOB Bollinger Band SqueezeThe RB1! Bollinger Bands bandwidth has narrowed to the narrowest width in 11 months as can be seen via the BandWidth indicator. Such a collapse in volatility usually precedes a volatility breakout in either direction. A Bollinger Band squeeze, which is a type of volatility breakout setup, is triggered when the bandwidth puts in a 6-month low which is a condition that has been achieved. This criterium is defined in the book “Bollinger on Bollinger Bands” by John Bollinger in the chapter "The Squeeze." The book states that a squeeze may oftentimes head fake and that a parabolic SAR (PSAR) may be used as a reversal trigger for an open trade or a trigger point for opening a new position in the direction price was heading when it hit the PSAR. Volume indicators and other technicals should be used to try and determine the direction of the squeeze and that is what I’ve done. Accumulation/Distribution% which is detailed in the book and linked below as an indicator I’ve published is trending down which is not necessarily the suggested use of the indicator but it was the best hint I could find about the direction of the breakout. %B is also trending down which again isn’t the intended use of the indicator but there’s not much else to go by. There’s a trendline which suggests going short and the 20-day sma is sloping downward which also suggests going short although it is pretty close to rolling up. Last time I noticed a squeeze setup was in soybeans and it broke out in the direction of the prior couple months which was down and is currently down with RBOB. The soybean idea is linked below.
I’ve come up with down as the anticipated direction of the squeeze breakout with a stop (and reverse if practical) at the PSAR (blue dots trailing stop) and a target of 1.9315 at the lower channel line which should fall above the previous low of 1.8799.
I will not actually be trading this because the notional value of 1 contract is $99,531 which is too high for me right now and it’s not a high conviction trade idea, more of a “I think this is what’s gonna happen, but it can go either way” type deal. It can head fake in one direction and break out in the other. If anyone has any ideas on which direction the volatility breakout is likely to be in based on technicals or fundamentals, please share.
Accumulation/Distribution% indicator:
Soybean Bollinger Band Squeeze idea:

Daily RB analysisDaily RB analysis
Sell trade with target and stop loss as shown in the chart
The trend is down and we may see more drop in the coming period in the medium term
All the best, I hope for your participation in the analysis, and for any inquiries, please send in the comments
Daily RB analysis Daily RB analysis
Sell trade with target and stop loss as shown in the chart
The trend is down and we may see more drop in the coming period in the medium term
All the best, I hope for your participation in the analysis, and for any inquiries, please send in the comments

Are gasoline prices heading back to 2.00 dollars a gallon? $ugaWholesale gasoline futures could be telling us that the driving demand is bad and just not there to support these high prices. War and geo politics is pushing Crude Oil prices up as well as the heating related products, but gasoline is trading on its own forces currently. With the rejection at around 4.00 a gallon, is the support here or are we destined to look for support lower?

Wholesale gasoline price down 38% from June supports demandConsumers have proven to be more sensitive to price than previously predicted

Oil bottom is near? Lots of news that would push oil commodities higher and just looking at this from a technical standpoint of volume, price action; it looks like the bottom is nearly here give it 1-2 months.

Gas Futures....Not Looking Good....3 months to midterms!
Which is it? Decline/stagnation, or we pop back up to that 3.25 gap and keep pump prices well over $4?

RBOB Gasoline Futures Analyze On 1h Timeframethe blue Zone represent an intense point, we can see how many times the market tried to break the S line on this Up trend.
so i think there is a good chance of an Upcoming Down Trend.
Any Thoughts On this One!!

Gasoline almost back to pre-war levelsGasoline in the US has been trending lower and lower, now down 30% from its ATH. It hasn't filled the breakaway gap yet, but I think it will do so in the next few weeks, and that could be an excellent opportunity to go long in the short term.
Oil has filled the gaps and chopped at support for a while but is looking weak. What is strange is how supply is limited, the spot market is strong... yet the paper market (futures, etc.) is invalid. Maybe the weakness is due to broadly slowing growth and economic activity, though I am not sure the REAL recession is here yet. The energy crisis isn't over, especially not in Europe... and this could get worse before they get better.
Most issues remain the same, and there is very little progress. There are no new refineries; few nuclear plants are active again, Russia is still limiting gas flows to Europe, sanctions make oil flows harder, and OPEC+ cannot increase capacity fast. Our energy needs constantly grow, yet our production has plateaued. Very little can be done now to ease our problems, and our problems will become even worse if the SPR is drained and the US stops supplying the world with oil from its reserves. Most solutions require time, and politically many of these are not welcome by the green movement. Essentially, we have energy producers and green activists colluding to increase energy prices so that the first make more money and the second to make themselves feel good while simultaneously destroying people's lives and the environment.
I believe crude oil could get down to 75$ and even 55$ in the short term but ultimately will go much higher once the Fed and other central banks are forced to cut rates and print money. It's all about managing your positions until we get to that point, as a big recession could cause oil and gas prices to tank. Oil and gasoline prices rose so fast that it is almost impossible for such a move not to cause a recession and consequently demand destruction.
If we look at Gasoline prices in terms of other fiat currencies, we can see that they went 70% higher than their 2008 peak, which is a lot. I multiplied the RBOB with DXY to get a better picture of the actual cost of gas for everyone outside the US, as the US is less than 25% of the global economy. That means that for almost 90% of the population and 75% of the worldwide economy, gasoline costs 70% more than in 2008. This will have tremendous consequences, especially given the rate at which prices increase.
In conclusion, although I don't think prices have bottomed, and we could see a sharp decline in the next few months, I believe gasoline and oil prices will go much higher, and dips are for buying.

GASOLINE Head and Shoulders likely to turn long-term bearishGasoline (RB1!) has been rising since the March 2020 bottom on a straight Channel until late February 2022 where war and inflation worries turned it parabolic as illustrated by the use of the Fibonacci Channel extensions. Following the June 06 market top, a Head and Shoulders (H&S) pattern was formed that hit (and so far rebounded on) the 1D MA200 (orange trend-line), a level touched for the first time since December 23 2021.
A break below the Support, should target the lower extension of the 1D MA300 (green trend-line), if not a retest of the Shoulder Resistance and potentially rejection on the 1D MA50 (blue trend-line) would initiate the 1D MA300 drop.
This trend-line has been Gasoline's Support since December 08 2020. This however may be the perfect opportunity to break it finally as the H&S pattern typically end such parabolas in fashion to at least the 0.618 Fibonacci Retracement level. Interestingly enough, that happens to be currently on the 1W MA200 (red trend-line).
--------------------------------------------------------------------------------------------------------
Please like, subscribe and share your ideas and charts with the community!
--------------------------------------------------------------------------------------------------------
