CLZ2020 trade ideas

Oil will drop soon Using Elliot Wave / Fibs I show possible reversal points and the ultimate destination which is down. I think once Israel announces their will be no ground "invasion" oil will start heading lower. I expect the announcement before long as pressure is building and the bombings have already killed enough innocents.


Crude Oil Secondary Top My 10/07/23 Crude Oil post noted that after a 13% drop it could be due for a bounce.
As of 10/13/23 it appears the bounce could be complete. Crude Oil has retraced a Fibonacci .50 of its 13% drop, and has taken the form of an Elliott wave Single Zigzag pattern. Also, Minor wave “A” is close to equal Minor wave “C”. The most common Fibonacci relationship in a Single Zigzag is wave “a” to “c” equality.
Hourly RSI has reached the overbought zone with a bearish divergence.
Crude Oil seasonal patterns are bearish until late December.
There is a high probability that a secondary top has formed. Crude Oil could soon begin a decline into the 70 area.

fresh money coming to the marketSupply and Demand: The price of crude oil is heavily influenced by the balance between global supply and demand. Events that affect these factors, such as production cuts, geopolitical tensions, or changes in energy consumption patterns, can significantly impact oil prices.
Conflicts and political instability in major oil-producing regions, such as the Middle East, can disrupt oil supplies and lead to price spikes.
Government policies and environmental regulations can influence the demand for oil, as well as the development and use of alternative energy sources, Oil is typically priced in U.S. dollars. Fluctuations in currency exchange rates can impact the price of oil for countries using other currencies.
The global shift towards cleaner and more sustainable energy sources is expected to impact the long-term demand for oil. As nations adopt cleaner energy alternatives, it could have implications for the oil market.
crude oil market is complex, and a multitude of factors can influence its price. Events and developments in these areas can have both short-term and long-term effects on crude oil economics.

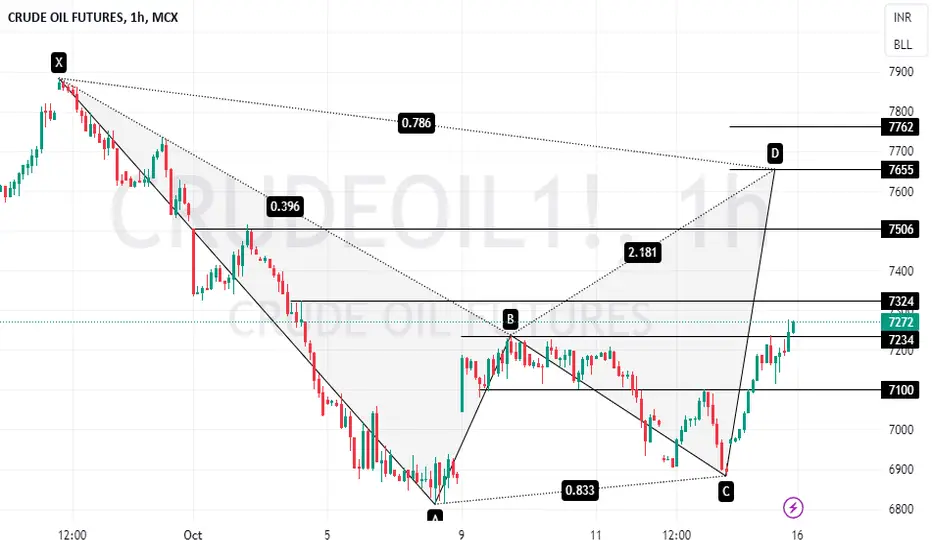
CrudeOilCrudeOil Chart Analysis.....16/10/23
Long : 7290
Sl : 7100
Target : 7324 / 7500 / 7650 / 7760
=============================
Short : Sustain Below 7100
Enjoy !
Crudeoil Crudeoil Chart Intraday
You can make profit in long/short by keeping both side view. You do not have to fight the market. When the stop-loss is hit, exit the position with loss and if possible, reverse trade. You have to understand the difference between intraday and positional view.
Enjoy !


CL1! Crude Oil Direction-11-Oct-2023Price broke the downward trendline (red line) and the bearish market structure. Now it is forming a bullish continuation pennant. It's possible the price will make a bearish fake out before reversing up. Let's wait for the confirmation on which direction of trades we should take.

Crude Oil (CL) Gap Fill LongWhile it's unclear whether crude, which has experienced large moves recently on account of the developing conflict between Israel-Hamas, wants to trade higher or lower over the longer-term, we’re looking to take near-term longs after filling the downside futures gap formed 10/6. We’re only showing down to a 30-minute chart here, but there are some smaller supply/sell zones @ ~84.25-84.75, which could be used for initial profit targets. If the trade works for a bounce, you can also consider applying mechanical targets @ 1:1, 2:1, 3:1, etc. Regarding an exact entry price and stop loss placement, the gap fill demand zone is a bit messy. The closing price of the gap itself, technically, is 82.81, so ideally we’d see CL trade to that #. However, markets aren’t always THAT precise, so it could put in a low at a slightly higher price. Furthermore, stop placement really depends on the timeframe used. The “distal” (lower bound) line of the daily demand/buy zone is 81.50, so if you can afford the risk, a physical stop could be placed below (never align your stops exactly w/ a zone’s range + don’t use whole numbers/quarters). More conservative placement could be slightly below 81.71 or 82.31, but there’s a higher chance you’ll be stopped out; depending on account/position size and risk tolerance, you can always deploy a “small loss, reenter” strategy. If you’re nimble enough, consider using a micro timeframe (single-digit minute, tick, or volume-based chart) to ID a trend reversal signal (higher high, higher low) before entering. If CL violates recently formed daily demand (82.81-81.50), be aware that there are “bear trap” areas waiting just beneath. Entries within the corrective segment of the uptrend that began in late-June are valid until prices breech the 77.59 pivot.
As always, feel free to provide feedback and/or ask questions. Good luck, be smart, and enjoy the journey!
Jon @ LionHart Trading

CRUDE OILPreferably suitable for scalping and accurate as long as you watch carefully the price action with the drawn areas.
With your likes and comments, you give me enough energy to provide the best analysis on an ongoing basis.
And if you needed any analysis that was not on the page, you can ask me with a comment or a personal message..
Enjoy Trading... ;)

War can bring oil price higher ?Oil has unsurprisingly opened higher this morning after Hamas launched a large attack on Israel over the weekend to which Israel has retaliated.
Also 4H chart wave analysis looking good to bet from this area expect wave 3 to come
big gap act as strong support is used to confirm this entry

#CrudeOil #XTIUSD Two Way trading Opportunities In this update we review the recent price action in the Crude OIl futures market and identify the next high probability trading opportunities and price objectives to target
PAST PERFORMANCE NOT INDICATIVE OF FUTURE RESULTS

Crude oil buy in sidewaysCrude oil buy in this sideways market. once breakout market will be volatile till 7332 target range. and then may fall from that 7332( after target will confirm)

Short Micro Crude OilDowntrend on both the 4hr and 60min charts. 15min supply zone with the 4hr TrendCloud.

Oil Price Rebound Eyes Monthly HighThe price of oil may attempt to retrace the decline from the monthly high ($91.88) as crude trades back above the 50-Day SMA ($85.17).
Crude Oil Outlook
The price of oil holds steady after gapping higher at the start of the week, but a close above the $85.70 (38.2% Fibonacci extension) to $86.60 (38.2% Fibonacci retracement) region opens up $88.20 (50% Fibonacci extension), with the next area of interest coming in around $90.70 (61.8% Fibonacci extension).
At the same time, failure to close above the $85.70 (38.2% Fibonacci extension) to $86.60 (38.2% Fibonacci retracement) region may push the price of oil back below the moving average, with a breach below the monthly low ($81.50) bringing the $77.80 (23.6% Fibonacci retracement) area on the radar, which sits just above the August low ($77.59).


CRUDE OILPreferably suitable for scalping and accurate as long as you watch carefully the price action with the drawn areas.
With your likes and comments, you give me enough energy to provide the best analysis on an ongoing basis.
And if you needed any analysis that was not on the page, you can ask me with a comment or a personal message..
Enjoy Trading... ;)

CL1: Buy ideaOn CL1 as you see on the chart we have a buy idea because we have the breakout with force the support line and the vwap indicator by a big green candle with a large green volume.Thanks!

Crudeoil will go above recent high 8000+ soonOn Our Harmonic pattern indicator based trade setup take trade as explained below :-
Early trades Buy or sell below/ above 23.6 %, safe trades buy or sell above / below 41% , after taking trade next upside or downside levels will be target ,
When reverse buy or sell signal appear then book profit on Target or trail SL to 23.6 % If trailing SL hit then early trade can be taken above or below 23.6 and safe trade can b taken above/ below 41% ..
Please note:-
It's working on news based and volitile market very well so exit if SL hit

Would the Middle East Conflict Push Gold and Oil Prices Higher?NYMEX: WTI Crude Oil ( NYMEX:CL1! ), COMEX: Micro Gold Futures ( COMEX_MINI:MGC1! )
Over the weekend, military conflict in Gaza between Israel and Palestine shocked the world. I condemn violence against civilians and pray for the victims and their families.
In the following paragraphs, I will discuss how the prices of strategically important commodities, namely gold and crude oil, might respond to the eruption of a global crisis.
Firstly, let’s look back into the recent past for those crises arising to a global scale. In the last five years, the world has witnessed three major crises of very different natures:
• US-China Trade Conflict: from January 2018 to January 2020, the world’s two largest economies imposed import duties to each other in a series of escalating actions and retaliations. A major event occurred on September 18, 2018, where President Trump added 10% tariff on nearly all Chinese-made products. The US-China trade conflict forever altered the global supply chain, with its impact being felt till today.
• Covid-19, the most severe pandemic in a century, from its outbreak in January 2020 to 2021. A big event that sparked market fear occurred on February 2, 2020, where the US imposed travel restrictions on incoming air passengers.
• Russia-Ukraine Conflict: the first military conflict in Europe since World War II, from February 14, 2022, till now.
Secondly, let’s measure how gold and WTI crude oil responded to these crises. For my analysis, I denote the day before Event Day as T0, where we may find last market prices before the impact hit. Event Day will be T+1, and then 1-week after (T+7), 1-month after (1M), 3-month after (3M), all the way through 1-year after (1Y). Here are what I found:
US-China Trade Conflict
• Gold spot price (T0) = $1,201.90 per Troy Ounce
• Price changes by time: -0.1% (T+1), +0.1% (T+7), +2.3% (1M), +3.3% (3M), +8.6% (6M), +11.6% (9M), +25.0% (1Y)
• Comment: Trade tension between US and China could push the global economy into a recession. Gold, a safe-haven asset, saw its market value growing 25% in a year.
• WTI crude oil spot price (T0) = $69.86 per barrel
• Price changes by time: +1.2% (T+1), +6.3% (T+7), +4.3% (1M), -27.7% (3M), -14.2% (6M), -24.6% (9M), -8.4% (1Y)
• Comment: High tariff raised the price consumers had to pay, hence reducing demand. Crude was down 28% three months after the all-in tariff was imposed.
Covid Pandemic
• Gold spot price (T0) = $1,574.75 per Troy Ounce
• Price changes by time: -1.0% (T+1), -0.1% (T+7), +2.6% (1M), +8.5% (3M), +24.4% (6M), +21.2% (9M), +16.6% (1Y)
• Comment: We saw the biggest stock market selloff in March 2020. Gold price was down initially as stock traders needed to raise money and meet margin calls. However, a flight to safety eventually took place, and gold was up 24% in six months.
• WTI crude oil spot price (T0) = $53.09 per barrel
• Price changes by time: -5.0% (T+1), -11.9% (T+7), -77.1% (1M), -61.4% (3M), -23.1% (6M), -31.1% (9M), +0.9% (1Y)
• Comment: Rapid Covid outbreaks stroke fear. Lockdowns put global activities to a pause. The pandemic wiped out oil demand, with WTI falling 80% in a month. April 20, 2020 made history as oil price of the expiring contract went below zero. As storage cost more than selling price, traders were willing to pay others to take away the crude for free.
Russia-Ukraine Conflict
• Gold spot price (T0) = $1,854.60 per Troy Ounce
• Price changes by time: -2.5% (T+1), -2.5% (T+7), +6.5% (1M), -1.8% (3M), -2.8% (6M), -5.0% (9M), +5.0% (1Y)
• WTI crude oil spot price (T0) = $91.25 per barrel
• Price changes by time: +4.7% (T+1), +5.3% (T+7), +30.7% (1M), +12.90 (3M), +1.1% (6M), +0.6% (9M), -17.2% (1Y)
• Comment: A major military conflict in Europe significantly raised the global risk level. Gold, the safe-haven asset, and crude oil, an energy commodity critically important in wartime, both went up in the first month, by 6.5% and 30.7%, respectively.
• However, the impact was short-lived. On March 16, 2022, the Fed begin hiking interest rates, which has become the driving force in global market. Impact from Russia-Ukraine became a secondary factor and sat in the back burner.
To sum up the above examples, I observe that gold prices usually go up in the aftermath of a global crisis. Crude oil has a mixed bag of reactions. If a crisis results in economic recession and a consequential reduction in oil demand, oil prices would go down. However, in the case of a major war, oil price would go up due to its strategic importance.
Review: Event-driven Strategy focusing on Global Crises
In June 2022, I introduced a three-factor pricing model for commodities futures:
Commodities Futures Price = Intrinsic Value + Market Sentiment + Crisis Premium
Intrinsic Value is the baseline cash price of the underlying commodities, determined by available supply, demand, inventory, shipping costs, and factors affecting these variables.
Market Sentiment indicates if investors are bullish or bearish. Whether speculative investors place more money on the long side or the short side affects the price of a futures contract. Market sentiment could be either positive or negative, resulting in a price premium or a discount of the intrinsic value.
The new Crisis Premium factor captures “Event Shock” during a global geopolitical crisis.
Previous trade example:
Russia and Ukraine together accounted for 28% of global wheat export. Wheat price shot up by 75% following the start of the conflict. I designed a Long Strangle options strategy on CBOT Wheat futures, and simultaneously bought out-of-the-money (OTM) call and put options. A “risk-on” outcome could push wheat price higher, making the calls more valuable, where a “risk-off” outcome would pull wheat price back down, making the puts in-the-money (ITM).
Trading Opportunities with Micro Gold
Since the September FOMC meeting, gold prices suffered a 6.3% drawdown, sending the futures price from $1,969 to $1,845. Friday settlement price was nearly 9% below the yearly high.
On the one hand, high-interest money market funds beat out non-interest-yielding gold investment; on the other hand, strong dollar raised the cost of gold purchase by foreign investors. As a result, gold prices have been under pressure.
However, my analysis illustrates that gold prices could rise in response to geopolitical conflicts. Since its founding, Israel had five major wars with its Arab neighbors. We do not know whether this time it would be contained as a regional conflict or spark a chain reaction of a global war. By the intensity of how it started, it doesn’t seem like a short one.
To express a view of rising gold prices, we could consider a long position in COMEX Micro Gold Futures ( AMEX:MGC ). The December contract (MGCZ3) was settled at $1,845. Each contract has a notional value of 10 troy ounces, or $18,450 at market price. CME Group requires an initial margin of $780 per contract.
Hypothetically, if gold futures go back up to $2020, its yearly high, the $175 ($2020-$1845) price increase would translate into $1,750 for a long futures position. If gold price goes down instead, each dollar of decline would result in a loss of $10 per contract.
Alternatively, we could consider the newly launched Micro Gold Options. A Long Strangle Options Strategy, where simultaneously buying OTM calls or puts, could be deployed if we expect a big move in gold price, but not certain of its direction.
Trading Opportunities with WTI Crude Oil
Since June, WTI crude oil first staged a nearly 40% rise, from $67 going to $93. However, it has seen a 9% drawdown since the Fed meeting on September 20th.
A major military conflict in the Middle East, the world’s most important oil producing region, threatens to interrupt oil supply and push up oil price. If the conflict is escalated to involve major oil exporting nations, the situation could be dire.
To express a view of rising crude price, we could consider a long position in NYMEX WTI Futures ( NYSE:CL ). The December contract (CLZ3) was settled at $83.18. Each contract has a notional value of 1,000 barrels, or $83,180 at market price. CME Group requires an initial margin of $6,186 per contract.
Hypothetically, if WTI futures go up above $100, which we saw from February to July 2022 in the first months of the Russia-Ukraine conflict, the $17 price increase would translate into $17,000 for a long futures position. If crude oil price goes down instead, each dollar of decline would result in a loss of $1000 per contract.
Similarly, the newly launched Micro WTI Options could express a view that a big move in oil price is expected, without knowing its direction.
Happy Trading.
Disclaimers
*Trade ideas cited above are for illustration only, as an integral part of a case study to demonstrate the fundamental concepts in risk management under the market scenarios being discussed. They shall not be construed as investment recommendations or advice. Nor are they used to promote any specific products, or services.
CME Real-time Market Data help identify trading set-ups and express my market views. If you have futures in your trading portfolio, you can check out on CME Group data plans available that suit your trading needs www.tradingview.com

CRUDE - LONGGood luck to everyone! This analysis is for educational purposes only and does not constitute financial advice. Conduct your own analysis before making trading decisions.
