Crude**CrudeOil:**
This week's forecast is for the price to fall to the bottom of the channel and reverse to the top of the channel.
CLJ2019 trade ideas

Crude Oil - Turbo TuesdayWell yesterday all targets where hit and some!
Today we have more targets to meet and London has not dissapointed so far
NY we will see what happens but for now I have Monthly ssl and weekly CE of wick and the Daily SSL as 3 main draws that will act as Bearish Bias.
That is the Forecast!

CRUDE OIL LONG from $72.75This is an area I have been waiting for weeks, and its coming up on this daily chart of Crude Oil futures.
I have highlighted the last to times price has aproached this trendline, expect to base for a bit, use an indication that turns positive and make your move.
The whole structure is in a very large triangle. I can tell you there is a fair value gap as well at in the entry target as the will get filled.
Target is to the top the triangle potentially this trade can last weeks.

Bullish on Crude oilNYMEX:CL1!
TVC:DXY
Right now as the Crude Oil prices are at *premium and technically we are around a strong support area I think we would see a rally somewhere between 67.5 and 72.5. However, this week, we have PMI and NFP news ahead so if the reports come out to support DXY, Crude oil might stay around this area for a while (as it's seasonality suggests)
* look at the closing price of the futures contracts between July and December 2024.

WTi - BUY
I see a Gap to be filled on MT4
They show up for various reason
Very high chance will return to Fill it
As it does in the Stock Market also
Has nothing to do with any News or how's ya father
Although they will make it appear it does
Even if it doesn't make sense.
They know 90% of traders have no idea about Fundamentals anywyay.
Wycoff Pattern also
Consolidating along the bottom picking up stops like a Vacume Cleaner.
Ultra Metre Bullish Green
: ) Lets See

CL - 8 Hrly - Weekly Forecast - 03 June 2024This is my weekly forecast of Oil for the week of 03 June 2024
We have closed below a key support level on the Monthly, so I now see this as bearish.
Looking to short at the daily inefficiency (FVG) for targets below liquidity lows.

WTI CRUDE OIL: Oversold offers a buy opportunity.WTI Crude Oil has turned oversold on its 1D technical outlook (RSI = 29.383, MACD = -1.620, ADX = 31.641) as the price is approaching the bottom of the 2 month Channel Down. As long as it remains under the 1D MA50, the long term trend will be bearish but the oversold conditions and the 1D MACD, which is replicating the early December 2023 bottom pattern, call for a low risk short term buy opportunity. We are targeting the top of the Channel Down and no higher than the 0.382 Fibonacci level (TP = 76.00).
## If you like our free content follow our profile to get more daily ideas. ##
## Comments and likes are greatly appreciated. ##

The Overlooked Impact of Lower Crude Oil Prices on Inflation Everyone talks about higher CPI when crude is up, but ignores it when prices drop.
Right now, lower crude oil is actually helping to soften inflation and weaken the dollar.
Keep an eye on the neckline around $70—but it might not be easy to break.

Short Term Elliott Wave Structure in Oil (CL_F) Favors DownsideShort Term Elliott Wave in Oil (CL_F) shows incomplete Elliott Wave bearish sequence from 04.12.2024 high. Down from there, wave 1 ended at 76.15 like the 1 hour chart below shows. Rally in wave 2 unfolded in a zig zag Elliott Wave structure. Up from wave 1, wave ((a)) ended at 78.05 and dips in wave ((b)) ended at 77.68. Wave ((c)) higher ended at 80.63 which completed wave 2 in higher degree.
US Oil has resumed lower in wave 3. Down from wave 2, wave ((i)) ended at 76.39 and wave ((ii)) rally ended at 77.52. The CL_F then nested lower with wave (i) of ((iii)) ended at 76.62. Wave (ii) of ((iii)) ended at 77.34. The commodity extended lower in wave (iii) towards 72.48 and wave (iv) ended at 73.69. Wave (v) lower is still developing. As market stays below 73.69 high, we are calling for one more low to wave (v) of ((iii)) and wave ((iii)) in higher degree. Once wave ((iii)) ended, expect near term rally to fail in 3, 7, or 11 swing as wave ((iv)) for further downside.

Crude Oil Price Susceptible to Test of February LowThe price of oil may attempt to test the February low ($71.41) as it falls for the fourth consecutive day.
Crude Oil Price Outlook
Crude extends the series of lower highs and lows from last week to push the Relative Strength Index (RSI) towards oversold territory, and the oscillator may show the bearish momentum gathering pace should it push 30 for the first time this year.
A break/close below the $72.90 (78.6% Fibonacci retracement) to $73.20 (78.6% Fibonacci retracement) region may push the price of oil towards $71.50 (38.2% Fibonacci extension), with a breach below the February low ($71.41) opening up the January low ($69.28).
Nevertheless, failure to break/close below the $72.90 (78.6% Fibonacci retracement) to $73.20 (78.6% Fibonacci retracement) region may keep the RSI above 30, with a move above $76.30 (61.8% Fibonacci retracement) bringing the $78.50 (50% Fibonacci retracement) to $79.00 (50% Fibonacci retracement) area on the radar.
--- Written by David Song, Strategist at FOREX.com

Thursday VooduWell we are in a sell program and we have respected this 1hr fvg.
So the remit is pretty simple for NY open..
Wait for a retracement for bearish prices.
The Bias is Bearish with the Magnet's as Price tragets for the weekly objectives.

Crude OilThis is not a trading signal, its an opinion, if you copy it, its on your own risk.
Position 1- Long
Position 2- Short
Oil is in down trend on the daily and 4 hours, but there is a pull back to the previous support that has became Resistance to retest it and then we will see continuation to down trend to the levels around $70.40 is the next support level.


Event-Driven Strategy using WTI Weekly OptionsNYMEX: WTI Futures ( NYMEX:CL1! ) and WTI Weekly Options ( GETTEX:LO5 )
OPEC+, the coalition of the world’s leading oil producers, will convene on June 2nd to decide production policy for the second half of the year. The powerful oil cartel consists of 13 OPEC members and 9 nonmember participants, and together produces about 59% of global oil production. This amounted to 48 million barrels per day (mn b/d) in 2022, estimated by the US Energy Information Administration (EIA).
Many analysts expect OPEC+ to continue the voluntary cut of 2.2 mn b/d, due to expire at the end of June. This voluntary cut, introduced in November 2023, adds to 3.6 mn b/d of production cut that have reduced the members’ crude output by about 5.8 mn b/d, or about 5% of global supply, since November 2022. I consider the move an attempt to shore up prices against higher US oil production and an uncertain economic outlook in China.
OPEC+ meeting is a significant event in the global crude oil market. We could liken its importance to that of the Federal Reserve meetings for equities and bonds. The group’s decision could tilt the balance of supply and demand one way or the other.
Here are three possible outcomes:
• No change: To renew existing cuts of 2.2 mn b/d through the end of the year.
• Additional cuts. This would reduce global crude oil supply.
• Ease of cuts. This would release more oil to the global market.
The oil market may stay calm if the OPEC+ decision conforms to investor expectations of no change. A surprise announcement of additional cuts would likely send oil prices skyrocketing. But any pullback from current cuts could sink oil prices down.
This provides a good setting for event-driven trading strategies.
Monitoring Crude Oil Market Sentiment Real Time
For a trading strategy to work, the trader needs to understand the market sentiment ahead of the actual event. While analysts give out opinions, it is the investors who put money in their mouth. Therefore, for unbiased decision making, we should look into trading data.
The CME Group OPEC Watch Tool is a great analytical tool for crude oil traders. It uses NYMEX WTI crude oil option prices to calculate the probabilities of certain outcomes from the nearest weekly and monthly options that expire around the OPEC meeting. In essence, it uses actual trading data, and go the extra mile to transform it into useful insights. This valuable tool is free and can be accessed via CME Group website.
The title chart includes a snapshot of CME Group OPEC Watch Tool. As of May 26th:
• OPEC Watch Tool expects a 79.1% probability of no change;
• There is a 18.8% probability of ease of cuts:
• Additional cuts remain a remote probability, at 2.2%.
I would like to point out that the market often exhibits overly pessimistic or overly optimistic sentiment. OPEC Watch Tool shows the collective wisdom of crude oil options traders. However, the trades are not scientific forecast. Market sentiment could change very rapidly. With this in mind, we need to closely monitor it with real-time trading data.
If, through independent analysis, a trader establishes an opinion very different to what the market suggested, he or she may express it with a trade position and wait for the market to correct its faulty assumptions.
Trading with NYMEX WTI Weekly Options
We could consolidate the three possible OPEC+ decisions into two:
• Within Expectation. No changes.
• Exceeding Expectation. More cuts or less cuts.
Investors expect OPEC+ to maintain its current cuts. If that turns out to be the case, oil prices may not move much following the announcement.
If a trader hosts this view, how could he or she turn it into a trade strategy? The trader could consider selling short-dated out-of-the-money (OTM) WTI crude oil options.
The July WTI futures contract ($CLN4) settled at $77.80 a barrel last Friday. Selling OTC strikes on WTI weekly options would enable the trader to collect an upfront premium. The first Friday after the OPEC+ announcement is June 7th. The weekly options ($LO1M4) will last only 12 days before its expiration.
How do we select options strikes to sell? There are really no rules of thumbs. For illustration purposes, let us pick an OTC call strike approximately $5 above current market price, and a put strike about $5 below.
• Last Friday, the 82.75 call strike settled at 17 cents. Each WTI weekly option contract has a notional value of 1,000 barrels. Therefore, the trader would collect $170 premium for selling 1 call.
• The $72.75 put strike settled at 29 cents. The trader would get $290 for selling 1 put.
• If the trader sells 1 call and 1 put, he or she could collect $460 for just 12 days.
Words of warning for options sellers:
• CME Group requires options sellers to deposit $6,001 margin for each July contract as the time of writing. Therefore, this strategy requires an investment of $12,002 for both call and put.
• If OPEC+ acts as expected and the oil market stays calm, the trader would get the margin deposit back when the options expire worthless.
• However, if oil prices move up above the call strike, the trader could incur a loss, potentially wiping out all the margin deposit, and probably more.
• If oil prices drop below the put strike, the trader would also experience a loss.
If the trader holds an opposite view, he or she could buy the OTC call or put options, depending on which direction the trader is leaning towards. For a small upfront premium, the trader could establish a position on crude oil, and potentially collect a big payout if OPEC+ changes heart.
For those who are uncertain of which way OPEC+ would go, but are convinced that they would change courses, traders could buy both OTC calls and OTC puts at the same time. This is an example of options strangle strategy.
Happy Trading.
Disclaimers
*Trade ideas cited above are for illustration only, as an integral part of a case study to demonstrate the fundamental concepts in risk management under the market scenarios being discussed. They shall not be construed as investment recommendations or advice. Nor are they used to promote any specific products, or services.
CME Real-time Market Data help identify trading set-ups and express my market views. If you have futures in your trading portfolio, you can check out on CME Group data plans available that suit your trading needs www.tradingview.com

Heading back to $76 Too oversold at the moment we’re heading back to $76 and possibly beyond before end of Summer. Culminating in a crash in Q4 along with worsening Recession

Crude Monday Drab Bias and ForecastI am HTF bearish on Crude OiL
I have PD arrays marked out that should be respected if market was to retrace and take some BSL.
The targets for today are Lows marked out.
Pretty simple.
Stay bellow 1hr fvg and 1hr -OB = BEARISH
Close above the 1hr FVG start looking for short term BSL

USOIL is Under PressureWTI crude oil futures are experiencing a downturn, currently priced at $79.37 per barrel, marking a 0.48% decrease. This decline is attributed to the global economic challenges that are negatively impacting the demand forecast. Similarly, Brent crude has seen a reduction in price, now at $83.88 per barrel.
The economic recovery in China is progressing slower than expected, and the anticipation of additional interest rate hikes is exacerbating concerns over economic growth, exerting further downward pressure on oil prices.
In the United States, crude oil inventories have witnessed an increase of 3.4 million barrels in the previous week, contributing to the existing oversupply. The persistent risk of a recession continues to place significant stress on the oil market.
Meanwhile, amidst these market conditions, option sentiment from the CME exchange suggests a robust support level at $75 for WTI futures in the nearest expiration series. This sentiment indicates a strong market belief that prices are unlikely to fall below this threshold, providing a measure of stability despite the current market volatility.
For investors and market watchers, these indicators from the options market are a critical piece of the puzzle, offering insights into future price movements and trader expectations.

Oil flow
All ideas are strictly my interpretation of price action. I am not a professional trader nor is this
professional advice.

2024-06-03 - a daily price action after hour update - oilGood Evening and I hope you are well.
wti crude oil
comment: In my weekly outlook I was bullish for 80 again, unless bears produced strong momentum below 76 and that was basically just on trading hour today where sold off for 232 ticks. 75 was the price I was talking about for weeks now and bears had a strong bear day down to 74. Depending on how you draw the bull trend line from the weekly/monthly chart starting in 2021-08, we are close enough or right on it. I do think bears surprised enough today to get another leg down because they clearly broke below the bear channel from last week. 72 is an obvious next target or the 2023 close at 71.6.
current market cycle: Bear trend
key levels: 70-77
bull case: The best the bulls can hope for is sideways movement and maybe a retest of the lower bear channel line around 74.5. Every touch of the 1h 20ema is violently sold and until that changes, bulls have no arguments on their side. They need to keep it above 74 or we will probably see 72 fast.
Invalid below 74
bear case: Bears did enough damage today to make bulls very cautious. Breaks below a bear channel with accelerated selling are not that common so it’s a strong breakout. No one knows where most algo’s draw the big bull trend line so we will probably find out over the next days. Right now it’s waiting for a pull-back to maybe the 15m or 1h 20ema where we wait for confirmation of another leg down. I got measured move targets between 70 and 72.
short term: Sideways to down - I wait for a pull-back or another strong momentum sell
medium-long term: We are seeing the big triangle playing out between 73 and 86 (could also be 87 but for now I see the spike above 83 as a failed breakout of the triangle. We hit the lower trend line and now we will test back up to above 83. —will update this tomorrow or Wednesday
trade of the day: Selling while the bar 10 was forming. I told my room to sell at 15:39 and we were short from 75.92 for +90 and immediately after another short on the bounce for +50.

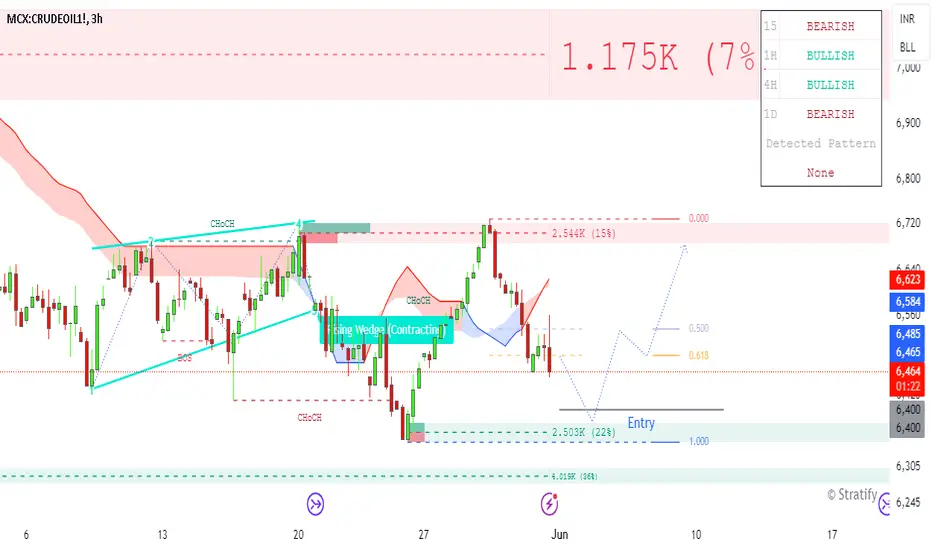
CRUDEOIL Buy Setup 3 hrs TGT with in a 3 daysSuper valid-looking! Leave a comment if you like my entry setup. This share is for educational learning purposes only, and I am not responsible for your profit or loss. Note: For more details, check the chart."
Navigating Crude Oil Volatility Around OPEC MeetingsOPEC is a unique organization whose decisions impact national sovereignty, energy security, and most directly on crude oil prices.
OPEC’s decisions have material influence on crude oil prices. All eyes on OPEC+ ministerial meeting taking place virtually now on June 2 (instead of an in-person meeting on June 1 as planned previously). OPEC is widely expected to roll over its production cuts until year-end to support prices until demand improves.
Supply-Demand balance will tilt in the second half of 2024 if OPEC decides to continue its production cuts as the global economy heads into a season of rising demand.
Source: CME Group OPEC+ Watch Tool as of markets on 27th May 2024
CME Group’s OPEC Watch Tool shows a 79.06% probability of the supply cuts remaining unchanged and an 18.79% likelihood of ease in cuts.
Negotiations within OPEC could be challenging as not all members are satisfied with production cuts.
Iraq's oil minister - Hayyan Abdul Ghani - said his country would not agree to another supply cut, as per Bloomberg . Iraq is OPEC's second-largest oil producer after Saudi Arabia.
Iraq and Kazakhstan's repeated breaches of their supply quotas have caused tension within the group. Promises from both countries to compensate for overproduction have not been kept.
Source: OPEC
OPEC+ has cut output by 5.86m bpd, approximately 5.7% of global demand as per Reuters .
The U.S. followed by China and India are the top three consumers of crude oil. US guzzles 20% with China consuming close to 16% of the world’s oil production.
China’s feeble demand has been a significant headwind and remains so despite its stimulus package.
CHINA'S TEPID DEMAND CONTINUES TO WEIGH ON OIL
China is the largest importer of crude oil and its second biggest consumer. Chinese demand for crude remains tepid.
Its economy is showing signs of recovery but remains uneven. Industrial output surpassed analyst expectations , growing by 6.7% YoY in April. Retail sales rose by 2.3% YoY well below analyst forecasts. Sluggish consumer demand impacts oil consumption. April oil imports fell 8.8% MoM to 44.7m tonnes.
In April, China's Manufacturing PMI rose to 51.4 from 51.1 in March, surpassing analyst expectations of 51.0. Services PMI slightly fell in April to 52.5 but remains in expansionary territory of >50.
Source: TradingView
Consumer Confidence Index rose to 89.1 but remains near record bottom levels. It is well below its average of 109.8 as Chinese consumers remain pessimistic due to persisting property crisis.
Source: TradingView
US SPR BEGINS REFILLING BUT WILL NOT MATERIALLY IMPACT OIL PRICES
The US government remains vigilant about gasoline prices in an election year. President Biden's energy advisor, Amos Hochstein, stated that the Strategic Petroleum Reserve (SPR) has enough stockpiles to address any supply concerns.
The Biden administration has been replenishing the SPR after having depleted it by 180 million barrels in 2022. US government bought back 32.3 million barrels at an average price of USD 76.98/barrel throughout 2023 and early 2024.
Having cancelled purchase of three million barrels due to elevated prices, it resumed refilling by looking to buy 3.3 million barrels earlier this month.
NAVIGATING OPEC DECISION IN JUNE
CME Group’s OPEC Watch Tool shows likelihood of different outcomes using WTI Crude Oil option prices. It assigns likelihood to each outcome based on nearest weekly & monthly options.
Probabilities for the June meeting is derived from the Jul 2024 monthly contract (LON4) and the closest active weekly option prices.
Source: CME Group
The market’s assessment of OPEC’s decision changes dynamically. Navigating a constantly shifting volatile landscape requires liquid instruments that are curated for duration risk. The CME WTI Weekly Options do precisely that.
It enables superior risk management to deftly manage short-term price fluctuations with reduced premiums due to short time-to-expiry. Traders can hedge against near-term price volatility stemming from OPEC meetings, EIA reports, geopolitical events, and weather shocks.
CME Group offers Monday, Wednesday, and Friday weekly options, each with four options available at the beginning of the month, in addition to monthly options. As each weekly option expires, new listings are introduced for the following week. These are settled into WTI Crude Oil futures.
HYPOTHETICAL TRADE SETUP
In the lead up to OPEC+ meeting, implied volatility of WTI prices is low but expected to expand closer to date.
Source: CME Group
Crude oil price action will remain muted if OPEC+ decides to extend its current voluntary cuts of 2.2 million bpd. Weekly options can help harvest near-term volatility to benefit from muted price moves using iron butterflies.
The iron butterfly is a limited reward and limited risk options strategy designed to reap gains during times of low-price volatility.
It involves four legs to the trade, namely, (1) One short ATM call option, (2) One short ATM put option, (3) One long out-of-the-money call option, and (4) One long out-of-the-money put option.
Optimal condition for executing iron butterfly is when implied volatility is high while underlying commodity price action is expected to be mild.
Based on 27/May market prices, the hypothetical trade set up using weekly crude oil options expiring on 3rd June 2024 involves (a) Selling 78 ATM Call, (b) Selling 78 Put, (c) Buying 80 Call, and (d) Buying 76 Put.
Source: CME QuikStrike
At expiry, if WTI June crude oil prices settles between USD 76.6 and USD 79.4, this trade would generate a gain of USD 1.4/barrel or USD 1,400/lot using CME WTI Crude Oil options as each lot represents one thousand barrels.
If crude oil prices rally above USD 79.4/barrel, this trade can rake up maximum loss of up to USD 0.87/barrel or USD 870/lot. If oil prices collapse below USD 76.6, then this trade will result in maximum loss of USD 0.87/barrel or USD 870/lot.
Ignoring transaction costs, the iron butterfly exhibits a reward-to-risk ratio of 1.61x with a maximum upside of USD 1,400/lot and maximum loss of USD 870/lot.
MARKET DATA
CME Real-time Market Data helps identify trading set-ups and express market views better. If you have futures in your trading portfolio, you can check out on CME Group data plans available that suit your trading needs www.tradingview.com
DISCLAIMER
This case study is for educational purposes only and does not constitute investment recommendations or advice. Nor are they used to promote any specific products, or services.
Trading or investment ideas cited here are for illustration only, as an integral part of a case study to demonstrate the fundamental concepts in risk management or trading under the market scenarios being discussed. Please read the FULL DISCLAIMER the link to which is provided in our profile description.

Can the HOUSE CAPITALIZE Long above $80.00 Per Barrel...?NYMEX:CL1!
"If you train hard, you'll not only be hard, you'll be hard to beat." -Herschel Walker
Oil has been struggling to Break above $80.00 Per Barrel roughly this whole month of MAY and this week we could actually see buyers gain strength and get over the hump... However that is a long shot prediction! Now if this actually does come to pass then this is what I'll need to see in order to go LONG...
1) Price is currently trading around a 4Hr Supply Zone. ** I want to see buyers push price up N break the supply zone and continue towards the HTF S&R Zone....
2) We have a HTF Descending eR/LQ Trendline that I want to Buyers Breakout N push towards $80.00 Per Barrel... I would like to see a retest of the Failed 4Hr Supply Zone and eR/LQ trendline for buyers to gain more strength for pushing towards our target...
3) Now if we can get the sequence of events to take place that I stated above, Then we will wait for the break above $80.00 Per barrel with confirmed candle closures above price and above the S&R Zone... I want to see confirmed candle closures on the 30m TF N Below to establish conviction in the move from buyers to enter LONG....
4) Now if we can get the Break above $80.00 Per barrel with confirmed candle closures above price and above the S&R Zone then I'll Enter LONG and Target the break of the 4Hr Supply Zone price ($81.10 Per Barrel) 110 pts to be exact in our favor... Ill set my stop just below the S&R Zone EQ Level giving me roughly around a 2.7RR....
Remember when it comes to FRM (Financial Risk Management) our job is to manage the downside costs of printing High side returns of $$$ consistently... Let's Step!!
Stay Focused & Reach Excellence!!
#BHM500K #NewERA #Champions

light oilI expect a corrective movement for oil up to the $74 range.
If the price returns above 82 dollars, this analysis will be invalid.
