🚀📈The 3 Secrets To The Rocket Booster Strategy📈The problem with analysts on this stock is that they are giving neutral ratings,
they are not picking a position this is not a safe
way to inform investors
--
Because how can they invest in an environment where they have no clue on what to
do
--
This is why I am using the rocket booster strategy wh
Next report date
—
Report period
—
EPS estimate
—
Revenue estimate
—
−0.76USD
−133.00 MUSD
12.49 BUSD
124.59 M
About Community Health Systems, Inc.
Sector
Industry
CEO
Tim L. Hingtgen
Website
Headquarters
Franklin
Employees (FY)
61 K
Founded
1985
FIGI
BBG000BDY3Y7
Community Health Systems, Inc. engages in the provision of general and specialized healthcare services and outpatient services. The company was founded in March 1985 and is headquartered in Franklin, TN.

CYH - Fallen angel in Downward channel and flag breakout - longCYH - Fallen angel inside a Downward channel with flag breakout. Acorn already holds. SSS Signal, SMDI buy signal, and Fallen Angel signal. Double bottom on weekly chart.

CYH : A breakout potential to watch as markets waver**S&P 500 and Market Behavior:**
We've been tracking the S&P's journey, and it's been quite the ride. After shorting the S&P at yesterday's close by snagging some SDS (an inverse ETF), I cashed out this morning when we dropped to that first key support level. I don't feel trouble is over however It

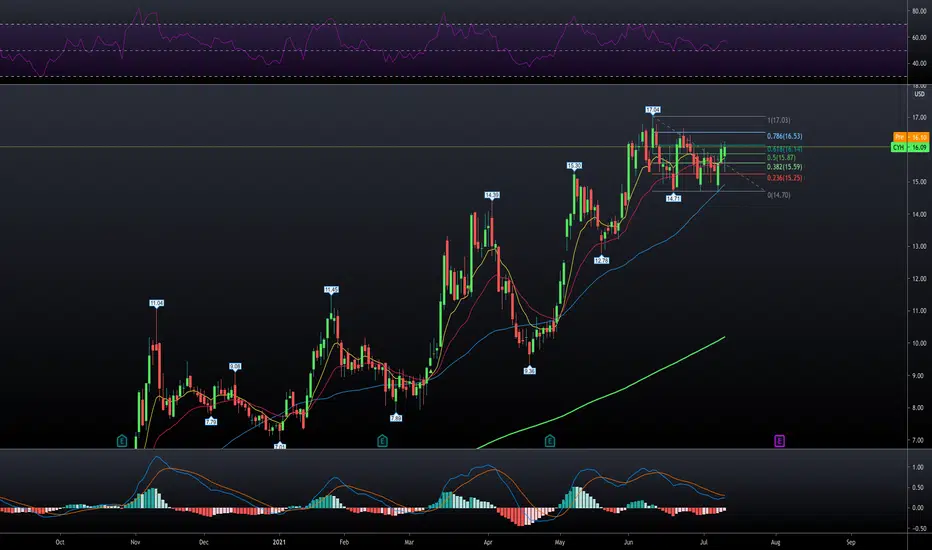
CYH Break OutCYH tested 14.71 three times in recent weeks and yesterday's candle tested several fibonacci levels. The MACD is curling up and is ready to cross. The RSI is still on the cool side.
Looking for a move with volume over the .61 fibonacci level to confirm the break out.
Short term target: 17.04 the


CYH, potential hidden bullish divergenceCYH has been making a series of HH and HL since breaking out of a 5 dollar resistance.
After making a high of 13.7, price has make a sharp correction and if the analysis is correct, hidden bullish divergence will be in play soon potentially
@nmike , i could be wrong.
will follow up with this in 2-

CYH: Bullish Pennant (49%), Bullish Flag (77%)Primary Target (short term):
Bullish Pennant, confirmed (49%)
PT = 17.62$
Secondary Target (Long term):
Bullish Flag, confirmed (77%)
PT = 17.94$

CYH - Buy Setup H1Buy Signal at the open: $12.49
Target $14.50
SL $11.50
Setup Time Frame hourly
Pullback on Daily

See all ideas
An aggregate view of professional's ratings.
Trade directly on the supercharts through our supported, fully-verified and user-reviewed brokers.


Frequently Asked Questions
The current price of CYH is 5.09 USD — it has increased by 6.93% in the past 24 hours. Watch Community Health Systems, Inc. stock price performance more closely on the chart.
Depending on the exchange, the stock ticker may vary. For instance, on NYSE exchange Community Health Systems, Inc. stocks are traded under the ticker CYH.
CYH stock has risen by 34.66% compared to the previous week, the month change is a 74.32% rise, over the last year Community Health Systems, Inc. has showed a 12.36% increase.
We've gathered analysts' opinions on Community Health Systems, Inc. future price: according to them, CYH price has a max estimate of 6.00 USD and a min estimate of 3.00 USD. Watch CYH chart and read a more detailed Community Health Systems, Inc. stock forecast: see what analysts think of Community Health Systems, Inc. and suggest that you do with its stocks.
CYH stock is 12.26% volatile and has beta coefficient of 2.67. Track Community Health Systems, Inc. stock price on the chart and check out the list of the most volatile stocks — is Community Health Systems, Inc. there?
Today Community Health Systems, Inc. has the market capitalization of 661.48 M, it has increased by 2.79% over the last week.
Yes, you can track Community Health Systems, Inc. financials in yearly and quarterly reports right on TradingView.
Community Health Systems, Inc. is going to release the next earnings report on Oct 23, 2024. Keep track of upcoming events with our Earnings Calendar.
CYH earnings for the last quarter are −0.17 USD per share, whereas the estimation was −0.14 USD resulting in a −25.26% surprise. The estimated earnings for the next quarter are −0.18 USD per share. See more details about Community Health Systems, Inc. earnings.
Community Health Systems, Inc. revenue for the last quarter amounts to 3.14 B USD, despite the estimated figure of 3.10 B USD. In the next quarter, revenue is expected to reach 3.07 B USD.
CYH net income for the last quarter is −13.00 M USD, while the quarter before that showed −41.00 M USD of net income which accounts for 68.29% change. Track more Community Health Systems, Inc. financial stats to get the full picture.
No, CYH doesn't pay any dividends to its shareholders. But don't worry, we've prepared a list of high-dividend stocks for you.
As of Jul 27, 2024, the company has 61.00 K employees. See our rating of the largest employees — is Community Health Systems, Inc. on this list?
EBITDA measures a company's operating performance, its growth signifies an improvement in the efficiency of a company. Community Health Systems, Inc. EBITDA is 1.46 B USD, and current EBITDA margin is 11.31%. See more stats in Community Health Systems, Inc. financial statements.
Like other stocks, CYH shares are traded on stock exchanges, e.g. Nasdaq, Nyse, Euronext, and the easiest way to buy them is through an online stock broker. To do this, you need to open an account and follow a broker's procedures, then start trading. You can trade Community Health Systems, Inc. stock right from TradingView charts — choose your broker and connect to your account.
Investing in stocks requires a comprehensive research: you should carefully study all the available data, e.g. company's financials, related news, and its technical analysis. So Community Health Systems, Inc. technincal analysis shows the strong buy rating today, and its 1 week rating is buy. Since market conditions are prone to changes, it's worth looking a bit further into the future — according to the 1 month rating Community Health Systems, Inc. stock shows the buy signal. See more of Community Health Systems, Inc. technicals for a more comprehensive analysis.
If you're still not sure, try looking for inspiration in our curated watchlists.
If you're still not sure, try looking for inspiration in our curated watchlists.